 Open Access Article
Electrochemical behaviour and analysis of Zn and Zn–Ni alloy anti-corrosive coatings deposited from citrate baths
Shams Anwar,
Yahui Zhang and
Faisal Khan *
*
Centre for Risk, Integrity and Safety Engineering (C-RISE), Faculty of Engineering & Applied Science, Memorial University, St. John's, NL A1B 3X5, Canada. E-mail: fikhan@mun.ca
First published on 14th August 2018
Abstract
Anticorrosive coatings are a useful approach for protecting steel structures/machinery against corrosion. Electrodepositions of zinc and zinc–nickel alloy films on steel substrates under various conditions from baths containing potassium citrate were studied. The effects of electroplating variables such as bath composition and current density on the coating composition, morphology, corrosion and mechanical properties were systematically investigated. The electrochemical and mechanical behaviour of Zn–Ni deposits obtained at 60 mA cm−2 from the citrate bath exhibited a lower corrosion current (Icorr) and a less negative corrosion potential (Ecorr) compared to pure Zn and Zn–Ni alloy coatings from the non-citrate bath. The crystallite size of the Zn–Ni coating deposited from the citrate bath was 35.40 nm, and the Ni content of the coating was 8.3 wt%. The morphological properties and crystalline phase structure of the alloy coating were examined by scanning electron microscopy (SEM) and X-ray diffraction (XRD). The topographical structure of the coatings was analyzed by atomic force microscopy (AFM). The dominant γ-NiZn3 (815) and γ-Ni2Zn11 (330) (631) plane orientations in the zinc–nickel alloy films improved the corrosion resistance. Zn–Ni films with smaller grain size and uniform coating had an increased impedance modulus and improved corrosion resistance.
1. Introduction
Corrosion is one of the significant sources of equipment failure and safety problems in offshore and marine operations.1,2 Anti-corrosive coatings are a useful approach for protecting steel structures/machinery against corrosion.2 Pure zinc coatings have been widely used as sacrificial coatings to protect steel structures from corrosion. To improve the corrosion resistance properties of steel in a harsh environment, significant efforts have been made to strengthen their anti-corrosive properties.3,4 One of the ways to improve the corrosion resistant properties of zinc coating is to make alloys with Fe, Cu and Ni. According to the literature,5,6 zinc alloy coatings such as Zn–Ni,7–9 Zn–Cu10 and Zn–Fe11 alloy films are often used to provide excellent corrosion resistance and maintain strong mechanical properties for steel equipment. They have better corrosion resistance compared to pure zinc coatings.5,6 Electrodeposition is one of the most economical and frequently used technologies for producing metallic coatings.12 The Zn alloy coatings deposited from citrate baths have been studied by Silva et al.; (2010) they deposited the Cu–Zn alloy coating on a mild steel substrate from a bath containing sodium citrate as the complexing agent, and benzotriazole and cysteine as additives. The results demonstrated that the coatings obtained with additives were brighter with small grain size. Cysteine, in an electrodeposition bath, increases the potential for the hydrogen evolution reaction (HER) and also prevents direct zinc deposition, and the deposited film exhibits high corrosion resistance.10 It was found that citrate significantly increases the stability of the baths and denser coatings are deposited due to higher bath pH.9Assaf et al. (1995) studied the effects of electroplating parameters such as bath composition, temperature and current density on the deposition of copper, zinc and brass on a steel substrate. However, they found that the zinc deposited at a low current density (<3 mA cm−2) and low zinc content (<15 g dm−3) in the bath affected the formation of fine grains and left some bare areas. This behaviour may be due to the low cathodic current efficiency of zinc deposition and the steady evolution of hydrogen gas.13
Rastogi and Pandey (2009) studied the electrodeposition of Zn–Mn–Mo alloy from citrate baths by investigating various parameters such as current density, temperature, pH, deposition time and the concentrations of chemical compounds. They found that the optimum conditions were 30 g L−1 ZnSO4·H2O, 60 g L−1 MnSO4·H2O, 4 g L−1 (NH4)2MoO3, 5 g L−1 C6H8O7·H2O, pH 2.05, temperature of 25 °C, deposition time of 30 minutes, and current density of 4.0 A dm−2; semi-bright, light grey and adherent deposits were obtained.14
Nowadays, Zn–Ni alloy coatings are eco-friendly substitutes for the toxic cadmium coating7 and have attracted significant attention due to their ability to provide better corrosion resistance and mechanical properties at higher temperatures and under severe environmental conditions, compared to pure zinc and other zinc alloy coatings.9 Several analyses have been undertaken to understand the characteristics of the electrodeposition process of Zn–Ni alloys. It was found that the features of the deposited coatings depend on the current density, pH, bath composition, applied voltage, additives and temperature.6 The phases and crystal structures of the surfaces of the deposited Zn–Ni alloys are significant characteristics that control the corrosion resistance and other mechanical properties.7,8
As seen from the above literature, several experimental studies have been implemented on the Zn–Ni deposited from citrate bath under various operating conditions. To the best of the authors' knowledge, there has not been a systematic study that specifically compares the pure Zn and the Zn–Ni alloy deposited from citrate and non-citrate baths, or on the optimum parameter conditions that suppress the hydrogen evolution reaction (HER) to improve the corrosion resistant properties of the coatings. Therefore, to bridge this gap, the present research is directed at investigating and analyzing the pure Zn and Zn–Ni alloy deposited under various operating conditions. Herein, we report the use of pure Zn and Zn–Ni alloy coatings on steel substrates to improve corrosion resistance, using potassium citrate as a complexing agent. The effects of plating variables such as bath composition and current density on coating composition, morphology and corrosion properties have been investigated. The XRD technique was used for structural phase analysis and to calculate the average crystal size of the coating. SEM was used for morphological analysis and AFM was used for topographical analysis. The electrochemical behaviour of the deposition bath on steel plates was studied by cyclic voltammetry (CV). Potentiodynamic polarization measurements (Tafel) and EIS were carried out to evaluate the corrosion protection performance of the Zn–Ni alloy coatings. The equivalent electrical circuits obtained from the experimental data fitted to Nyquist and Bode plots were also used to compare the Zn–Ni deposited from citrate with the pure Zn and Zn–Ni from the non-citrate bath. The effects of the optimum operating parameters on the deposition character and their corrosion behaviour have been observed and are discussed.
2. Challenge: establishment of stable baths for Zn and Zn–Ni containing coatings
Due to the negative reduction potential of the Zn/Zn2+ electrode, it is more challenging to electroplate Zn than hydrogen gas:16| Zn2+ (aq) + 2e− → Zn (s) EZn/Zn2+ = −0.762 V |
| 2H+ (aq) + 2e− → H2 (g) E2H/H2 = 0.000 V |
The hydrogen ions in the electrolyte solution will be deposited before zinc since H+ ions have a more positive reduction potential in the standard state. To overcome and modify this problem, a higher pH of the electroplating bath is preferable. Generally, a bath with a high pH (alkaline) is not stable. Therefore, most electroplating is developed in an acidic bath. The major problem with the use of an acidic bath is that the hydrogen evolution reaction occurs in the electrolyte and exhibits non-uniform coatings that are less corrosion resistant. Although the citrate bath in this work has a relatively low pH, the addition of citrate is helpful in stabilizing the plating bath during electrodeposition because the reduction of hydrogen will increase the pH around the cathode. Thus, the existence of citrate in the bath can prevent the precipitation of metal hydroxides around the cathode.
To electrodeposit Zn coatings with suitable compositions and microstructures that lead to ideal corrosion resistant and mechanical properties, the development of a stable plating bath with relatively high pH is vital. To suppress hydrogen deposition and stabilize the plating baths, alkalis and complexing agents (e.g., acetate and citrate) were added to the baths for ideal Zn, Zn–Ni and Zn–Ni composite electroplating. According to the above results, the corrosion resistant properties, uniformity, thickness, and the mechanical hardness of the plated films were also improved.16–20
2.1 The effect of the complexing agent on the stability of the plating bath
The stability of the electroplating bath was studied using a stability diagram or Pourbaix diagram. Complexing agents such as potassium citrate were employed to stabilize the metal and alloy plating baths.Fig. 1(a) and (b) show the Pourbaix diagrams calculated for the Zn–Ni alloy deposited from non-citrate, 0.0816 M and 0.163 M citrate baths. The dashed lines ‘a’ and ‘b’ refer to the equilibrium lines for H+/H2 and (O2 + H2O)/OH−, respectively.21
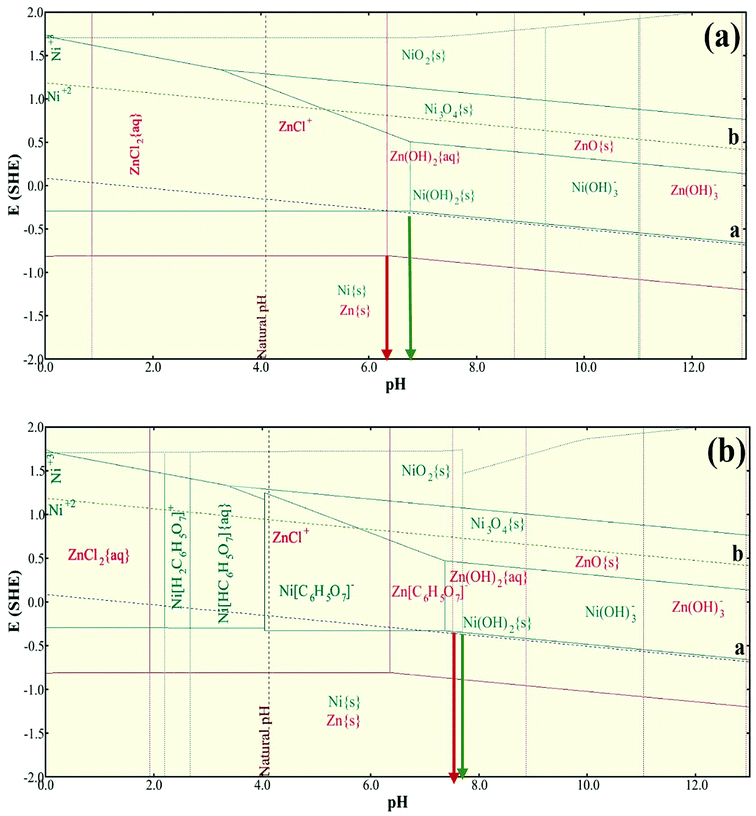 | ||
| Fig. 1 (a) Pourbaix diagram for Zn–Ni alloy plating from the non-citrate bath; (b) Zn–Ni alloy plating from the 0.0326 M citrate bath. | ||
It can be seen from the figure that, thermodynamically, the stability of a Zn–Ni alloy plating bath is dominated by the precipitation of Zn(OH)2 and Ni(OH)2 at pH 6.2 and 6.8, respectively (Fig. 1(a)). The red line indicates Zn(OH)2 whereas the green line indicates Ni(OH)2. After the addition of 0.0326 M potassium citrate, the Zn–Ni alloy plating bath was thermodynamically stable until pH 7.2 for Zn(OH)2 and pH 7.8 for Ni(OH)2 was reached with the given concentration of metal ions (Fig. 1(b)), and the formation of the stable complexing species such as Zn[C6H5O7]− and Ni[C6H5O7]. Therefore, it was observed from these two Pourbaix diagrams that the Zn(OH)2 and Ni(OH)2 precipitation was extended to one pH on the pH scale, which stabilized the electrolyte bath.
From Fig. 1(b), it is apparent that citrate has the strongest complexing power for Zn ions, followed by Ni ions. Therefore, Zn[C6H5O7](aq) and Ni[C6H5O7](aq) contribute to stabilizing the Zn–Ni elements in the bath solution.
The calculated stability diagrams demonstrate that, thermodynamically, citrate can effectively stabilize Zn–Ni alloy plating baths, preventing the precipitation of metal hydroxides at a higher pH. Bath stability tests on baths with and without the addition of potassium citrate were conducted.
3. Experimental details
The electrodeposition experiments were carried out in a bath with a 200 mL solution at room temperature. A rectangular steel plate of 10 cm2 was used as the working electrode (WE), and a graphite rod was used as the counter electrode (CE). The reference area of the coated sample was 1 cm2 for the electrochemical analysis. The CE and WE were connected to the DC power supply via a multi-meter. There were three types of baths prepared: bath-1 (chloride bath, without potassium citrate, containing ZnCl2, SDS and NaCl); bath-2 (chloride bath, without potassium citrate, containing ZnCl2, NiCl2·6H2O, SDS and NaCl); and bath-3 (chloride bath, with potassium citrate, containing ZnCl2, NiCl2·6H2O, SDS, NaCl, K3(C6H5O7) and H3BO3), as shown in Table 1. They were degreased with 10 wt% sodium hydroxide solution for 5 min, then rinsed with 10% hydrochloric acid and alcohol or acetone for a few seconds. The operating conditions for electrodeposition are listed in Table 2. After deposition, the Zn and Zn–Ni alloy coatings were washed with distilled water and dried in air.| Bath composition | Concentrations | ||
|---|---|---|---|
| Bath-1 | Bath-2 | Bath-3 | |
| Zinc chloride (ZnCl2) | 60 (g L−1) | 60 (g L−1) | 60 (g L−1) |
| Nickel(II) chloride hexahydrate (NiCl2·6H2O) | — | 20 (g L−1) | 20 (g L−1) |
| Boric acid (H3BO3) | — | — | 8 (g L−1) |
| Sodium dodecyl sulfate (SDS) | 1.7 × 10⁻⁵ M | 1.7 × 10⁻⁵ M | 1.7 × 10⁻⁵ M |
| Potassium citrate (K3(C6H5O7)) | — | 8 (g L−1) | |
| Sodium chloride (NaCl) | 8 (g L−1) bath pH = 2.0 | 8 (g L−1) bath pH = 2.0–2.5 | 8 (g L−1) bath pH = 2.5–3.0 |
| Operating conditions | Samples |
| Anode | Graphite rod |
| Cathode | Steel plates |
| Current density | 20, 40, 60 mA cm−2 |
| Plating time | 10 minutes |
| Stirred speed | 350 rpm |
| Temperature | Room |
Electrochemical analyses were performed using a ZAHNER IM6 electrochemical workstation produced by ZAHNER-Elektrik GmbH & Co. KG, Germany. The electrochemical analysis experiments were carried out in a conventional three-electrode cell with a 200 mL solution. A 10 cm2 rectangular steel plate was used as the cathode. A graphite rod was used as the anode. Silver/silver chloride with saturated potassium chloride as a salt bridge (Ag/AgCl/KClsat) was used as the reference electrode. The schematic stability diagrams were plotted using OLI Analyzer Studio software. The morphology of the deposited samples was investigated using a scanning electron microscope equipped with an energy dispersive spectrometer (FEI MLA 650F). A Rigaku Ultima IV X-ray diffractometer with a copper X-ray source and a scintillation counter detector (λ = 1.5418 Å) was used to study the crystal phase structures of the deposits, and the databases used to identify the peaks were pdf# 03-065-5310 and 00-004-0831 RDB Minerals, International Centre for Diffraction Database (ICDD).
The Debye–Scherrer equation was used to calculate the average crystallite size of the samples from the peak width at the half maximum of the crystal peaks (β):22
The topographical structure of the coatings was analyzed by atomic force microscopy (Asylum Research MFP 3D). A Vickers Microhardness Testing machine measured the hardness of the coating.
4. Results and discussion
4.1 Chemical compositions and surface morphology
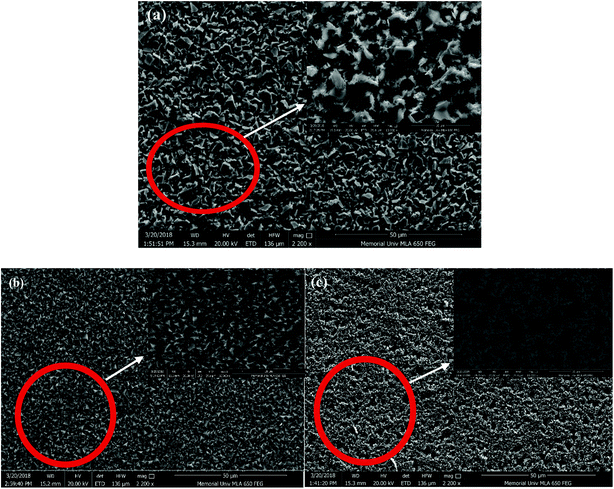
The surface morphologies of the electrodeposited pure Zn and Zn–Ni coatings deposited from the citrate bath and the non-citrate bath were investigated using SEM, as shown in Fig. 2. The deposited Zn–Ni alloy coating was developed, in terms of its uniformity, porosity and grain size, by varying the bath compositions and current density. As the current density increased, the over-potential increased, leading to an increase in the nucleation rate and reduction in the grain size of the coating. This was investigated and reported by El-Sherik et al.23 and Feng et al.24 Sample (a), which is the pure Zn coating deposited from the non-citrate bath at same current density, exhibited a larger grain size and a rough structure with some cracks and holes, as also shown in Fig. 3 using AFM analysis. Sample (b), deposited from the citrate bath, showed a uniform surface with smaller grain sizes; sample (c), deposited from the non-citrate bath under the same conditions, revealed non-uniformity and swelling with larger and coarser grain sizes found due to the HER, and the bath was not stable. Therefore, sample (b) showed uniformity with an adherent and dense Zn–Ni coating surface (Fig. 2(b)). The incorporation of Ni into the Zn matrices slightly modified the morphology of the Zn–Ni coatings. The Zn coating is composed of hemispherical structures; however, after incorporation, the structure changed.24,25 A similar result was demonstrated by Feng et al. (2015) on adding the complexing agents; a significant decrease in the grain size was observed, and the deposits were smooth, homogeneous, uniform, compact and fine-grained without any pores or pinholes at the surface,26 as shown in Fig. 2(b). The optimum value of the plating current density was 60 mA cm−2, with smaller grain size and denser coating. The coatings shown in Fig. 2 and 3 were plated at 60 mA cm−2. Rahman et al. (2009) reported that from 40–60 mA cm−2, the plating current density grain of the deposit was smaller and more uniform and no porosity was found; whereas, with increased plating, current densities after 60 mA cm−2 produced non-uniform crystals and coarse-grained coatings.15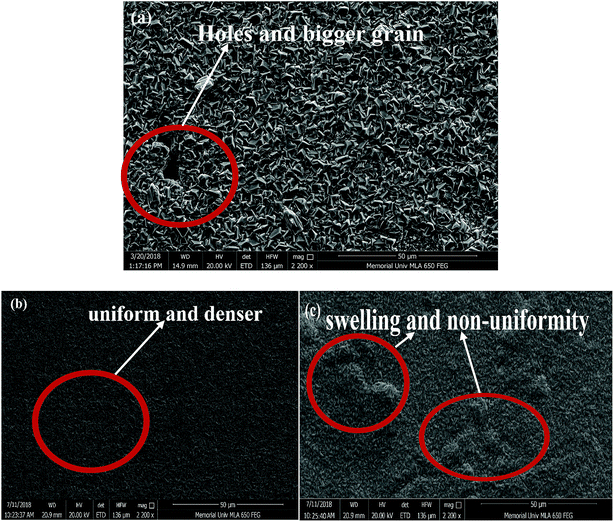 | ||
| Fig. 2 The SEM images of pure Zn and Zn–Ni alloy coatings: (a) pure Zn deposited from the non-citrate bath, (b) Zn–Ni deposited from the citrate bath, (c) Zn–Ni deposited from the non-citrate bath. | ||
The surface morphologies of the corroded pure Zn and Zn–Ni alloy coatings immersed in sodium chloride solution are shown in Fig. 3. All the images are at the same magnification but the image shown in the inset is at a higher magnification. It can be seen that the corrosion products were formed on the Zn and Zn–Ni alloy coatings. Sample (a), the pure Zn coating and sample (c), the Zn–Ni deposited from non-citrate, demonstrated the formation of the uniformly distributed voids and porous structures on the surface of the coating. When tensile and compressive stress were applied to the porous corroded samples, the samples cracked after prolonged exposure times.27 Sample (b) deposited from the citrate bath had less of this effect on the surface of the coating. Moreover, after the immersion test, uniform and compact corrosion products appeared on the sample (b) and attained higher corrosion resistant properties. As per the above results, after the immersion in 3.5% NaCl solution, the corrosion product was formed on the coated surface; therefore, the wettability of the coated surface had a significant effect on the corrosion prevention on the Zn and Zn–Ni deposits.28
4.2 Atomic force microscopy (AFM) analysis
The topographical 2D and 3D images of the surfaces of the pure Zn and Zn–Ni alloy coated samples, (a), (b) and (c), obtained by AFM measurement deposited from citrate bath and non-citrate bath are shown in Fig. 4. In the case of sample (a), the cathodic deposition was non-uniform, heterogeneous and had a large peak with bigger grains in comparison to the other samples. Samples (b) and (c) were less coarse and were uniform in texture. Sample (b) was uniform, homogeneous, and compact and exhibited small peaks with regular grain size, leading to higher mechanical and corrosion resistant properties. The additives or complexing agents were preferentially adsorbed on the Zn–Ni matrix and inhibited the Zn–Ni alloy depositions, resulting in the smaller reduction of Zn2+ and Ni2+ on these matrices, and therefore, smooth and homogeneous deposits were observed.29 The roughness factor illustrates the initial surface irregularities, non-uniformity and heterogeneity; therefore an irregular surface demonstrates a higher dissolution rate, especially in the presence of a corrosive environment.30 This surface factor suggests the non-linear dependence of the uniformity of the coating26,31 deposited from a citrate or non-citrate bath.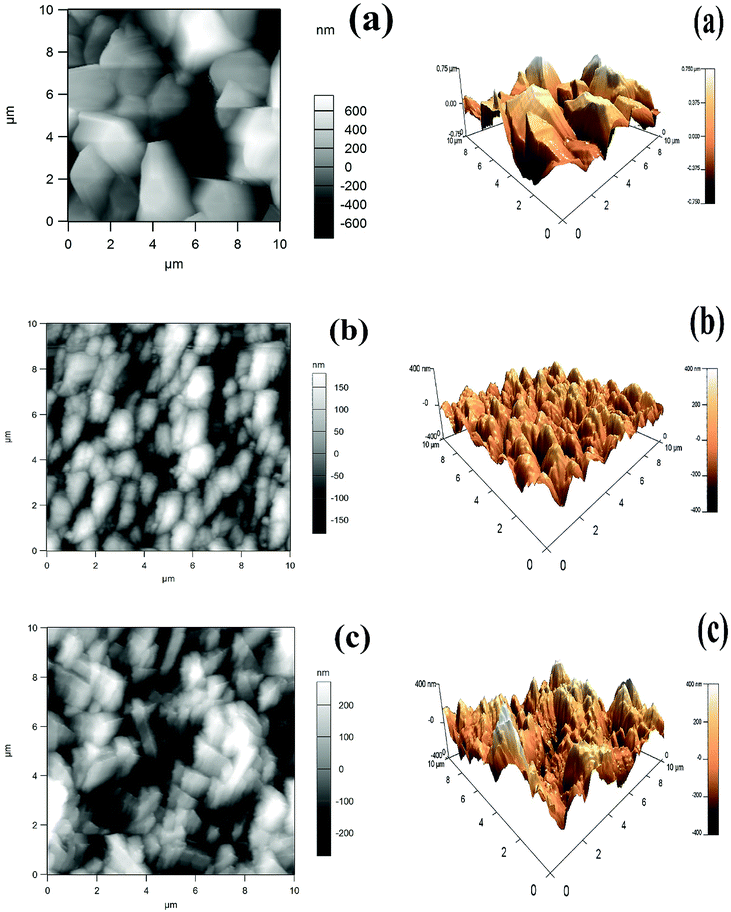 | ||
| Fig. 4 2D and 3D images of Zn and Zn–Ni alloy electrodeposited coatings: (a) pure Zn coating from non-citrate, (b) Zn–Ni coating deposited from citrate, (c) Zn–Ni coating deposited from non-citrate. | ||
4.3 Cyclic voltammetry studies
Cyclic voltammetry (CV) is used to characterize the electrochemical behaviour and kinetics of electrochemical reactions.32 Fig. 5 shows the CV behaviour and the influence of citrate and non-citrate bath on the pure Zn and Zn-Ni electroplated on steel plates at room temperature. The CVs under the given conditions were characterized by the presence of two peaks in an anodic scan and one peak in a cathodic scan. The anodic peaks seen in the anodic scan during the electrochemical oxidation of the alloy were attributed to the dissolution of the coating in the alloy from different intermetallic phases.33 The two anodic peaks at 293 mV for the Zn–Ni alloy deposited from citrate and non-citrate correspond to the dissolution of constituents γ-NiZn3 and γ-Ni2Zn11, and dissolution of Ni from their phases.8,34,35 Therefore, the voltammetric behaviour of the Zn–Ni alloy indicates the properties of its structure and components in the deposited phase. The anodic current density of the pure Zn coating was high in comparison to the Zn–Ni coating, leading to an increase in the dissolution rate of pure Zn.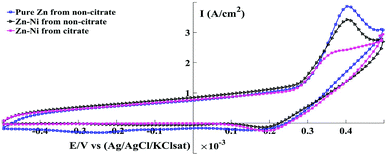 | ||
| Fig. 5 Cyclic voltammogram for pure Zn and Zn–Ni coating from electrolytic baths at a scan rate of 5 mV s−1. | ||
4.4 X-ray diffraction (XRD) analysis
The distinct crystalline phase and orientations of the pure Zn and Zn–Ni coated XRD patterns were observed under different conditions. Fig. 6 shows that the coatings contain three dominant diffraction peaks: Zn (101), γ-NiZn3 (831) and γ-Ni2Zn11 (330). The critical peaks of pure Zn coating at 36°, 43° and 54° match Zn (002), Zn (101) and Zn (102), respectively. The peaks at about 38°, 43° and 73° correspond to γ-NiZn3 (831) and γ-Ni2Zn11 (330) and (631) phases of the Zn–Ni alloy, respectively. The other peaks at 51°, 69° and 82° match the Zn–Ni (111) and Zn (110) (200) phases, respectively. The Zn–Ni coating deposited from the citrate bath had the highest intensity of the γ-phase (γ-Ni2Zn11) with (330) plane orientation, whereas for the pure Zn coating it was Zn (101) as shown in Fig. 6(a) and (b). Moreover, the peak value of the γ-phase with the (330) plane orientation was higher than that of other γ-phase orientations such as γ-NiZn3, demonstrating that the γ-phase with the (330) plane orientation plays an assertive role in the Zn–Ni alloy coatings.28,31,36 The intensity of the γ-phase (γ-Ni2Zn11) of sample (b) was high in comparison to sample (c). The crystal peaks intensities illustrated the information on the number of phases and also the relative amounts of Zn–Ni in the deposits.37 Therefore, the coating with high-intensity γ-phase with (330) (831) plane orientation exhibited better corrosion resistance.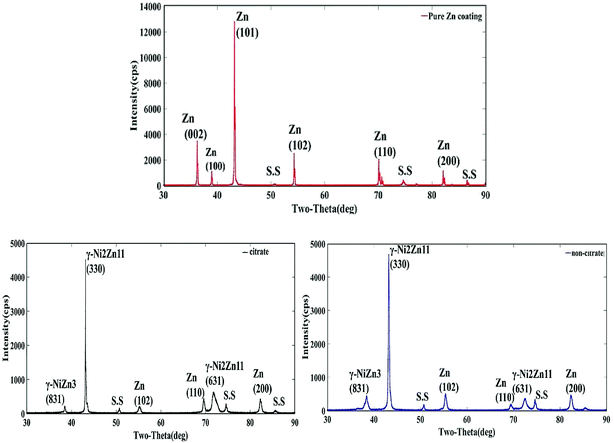 | ||
| Fig. 6 XRD patterns for the pure Zn and Zn–Ni alloy coatings using different baths: (a) pure Zn coating deposited from non-citrate, (b) deposited with citrate, (c) deposited from non-citrate. | ||
4.5 Potentiodynamic polarization analysis
The potentiodynamic polarization curves of the pure Zn and Zn–Ni alloy films deposited from citrate and non-citrate baths at three different plating current densities ranging from 20–60 mA cm−2 were studied. The polarization analysis was performed in an aerated 3.5% NaCl solution at room temperature, and the scan rate was 10 mV s−1 as tabulated in Table 3. The polarization curves of different coatings were measured at their open circuit potential (OCP), and corrosion current densities (Icorr) and corrosion potentials (Ecorr) were calculated from the intercepts on the Tafel slopes by extrapolation, obtained with reference to the silver and silver chloride electrode with saturated potassium chloride as the salt bridge (Ag/AgCl/KClsat). The corrosive activity of the Zn–Ni alloy coating in corrosive media is directly related to the corrosion potentials. The corrosion resistance of the coating is mainly related to the structural morphologies, chemical compositions and phase compositions.37| Samples | Deposition current density, (mA cm−2) | Corrosion potential, Ecorr (mV) | Corrosion current, Icorr (mA cm−2) | Corrosion rate (μmpy) |
|---|---|---|---|---|
| (a) Pure Zn from non-citrate | 20 | −820 | 7.39 | 40.51 |
| 40 | −810 | 6.22 | 38.58 | |
| 60 | −814 | 4.76 | 41.54 | |
| (b) Zn–Ni from citrate | 20 | −798 | 7.15 | 29.8 |
| 40 | −780 | 5.91 | 36.13 | |
| 60 | −760 | 2.98 | 27.28 | |
| (c) Zn–Ni from non-citrate | 20 | −800 | 8.51 | 35.27 |
| 40 | −812 | 8.90 | 38.29 | |
| 60 | −790 | 5.93 | 32.64 |
It has been shown that the principal cathodic reduction of pure Zn and Zn alloy is oxygen reduction, which is the rate controlling step for the corrosion.38 However, the superior corrosion resistance of the deposits corresponds to the more positive corrosion potential (Ecorr) values or lower corrosion current (Icorr).39 Table 3 shows that the Ecorr of the pure Zn coating at 40 mA cm−2 deposited from the non-citrate bath is less negative in comparison to the Zn plated at 20 and 60 mA cm−2. However, Icorr for the pure Zn coating plated at 60 mA cm−2 exhibits a lower value (4.76 mA cm−2). Therefore, the increase in plating current density leads to less corrosion resistance properties for the Zn coating. Moreover, for the Zn–Ni alloy coatings deposited from citrate and non-citrate baths, as the plating current density increased, the Icorr decreased, and less negative Ecorr were recorded. Assaf et al. obtained similar results.40 Moreover, Abou-Krisha41 found that increasing the plating current density improved Ni content in the coating and shifted the Ecorr toward more positive potential, which led to higher corrosion resistance properties.
The Ecorr of the Zn coating deposited from the non-citrate bath at 60 mA cm−2 exhibited a more negative potential (−0.810 V), whereas, those of Zn–Ni alloy coatings deposited from the non-citrate bath and citrate bath were −0.790 V and −0.760 V, respectively. It is also noticeable from Table 3 that the Ecorr shifted to more positive values as the plating current density increased, and the Zn–Ni alloy coating deposited from citrate bath improved the corrosion resistant properties of the steel.
The Icorr of sample (b) at 60 mA cm−2 was 2.98 mA, whereas for sample (a), it was 4.76 mA and for sample (c) it was 5.93 mA. The sample (b) coating possessed a lower Icorr value than the other coated samples. The least Icorr is due to the stable citrate bath Zn–Ni coated samples with decreased HER, which exhibited uniform and high anti-corrosive coating and is also shown on the SEM images for sample (b), which has small grain size, and compact, bright and uniform Zn–Ni coating. The sample (c) coated film had swelling and non-uniformity on the surface due to hydrogen evolution. Moreover, as the current density of the Zn–Ni plated sample increased, it led to a decrease in the corrosion rate of the coated sample, whereas for pure Zn plating, it increased (Table 3).
The optimal results of the Zn and Zn–Ni coated samples deposited from citrate and non-citrate baths at 60 mA cm−2 current density are shown in Fig. 7, illustrating that the Zn–Ni alloy coating from the citrate bath exhibited less Icorr and more positive Ecorr in comparison to the pure Zn and Zn–Ni alloy coatings deposited from the non-citrate bath, which led to the enhanced corrosion–resistant properties of the coating. Zn–Ni alloy was deposited at lower and higher concentrations of citrate. However, the coated sample was non-uniform and exhibited minimum corrosion resistance properties to the bare steel. Therefore, after the exploration test, these concentrations were selected and used in this paper.
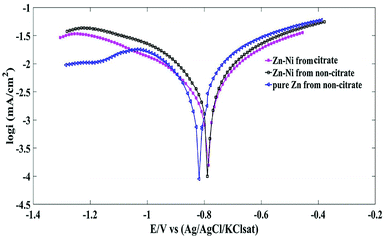 | ||
| Fig. 7 Polarization curve for the pure Zn and Zn–Ni alloy coatings deposited from citrate and non-citrate baths. | ||
As observed from Table 4, that the corrosion potential of the pure Zn coated samples are more harmful than the Zn–Ni alloy coating. This implies that all of the electrodeposited Zn–Ni samples offer more corrosion protection to the bare steel substrate. The corrosion rate of Zn–Ni deposited from citrate and non-citrate was 27.28 μmpy and 41.54 μmpy, whereas for pure Zn, it was 32.64 μmpy; this implies that the Zn–Ni deposited from citrate exhibited higher corrosion resistant properties in comparison to Zn–Ni from non-citrate and pure Zn coatings. On the other hand, Table 4 indicates that the Ni content in the Zn–Ni coating deposited from citrate bath is 8.3 wt%, whereas Zn–Ni without citrate is 4.3 wt%. This can be attributed to the higher surface activity of Zn ions in comparison to nickel ions. The average crystal size of the pure Zn coating is 80.92 nm, whereas the Zn–Ni coating deposited from the citrate bath is 35.40 nm (Table 4).
| Bath condition | Coating composition (wt%) | Average crystallite size (nm) | Ecorr (mV vs. Ag/AgCl) | Icorr (mA cm−2) | Corrosion rate (μmpy) | |
|---|---|---|---|---|---|---|
| Zn | Ni | |||||
| (a) Pure Zn from non-citrate | 100 | — | 80.92 | −814 | 4.76 | 41.54 |
| (b) Zn–Ni from citrate | 91.7 | 8.3 | 35.40 | −760 | 2.98 | 27.28 |
| (c) Zn–Ni from non-citrate | 95.7 | 4.3 | 40.78 | −790 | 5.93 | 32.64 |
4.6 Electrochemical impedance spectroscopy (EIS) analysis
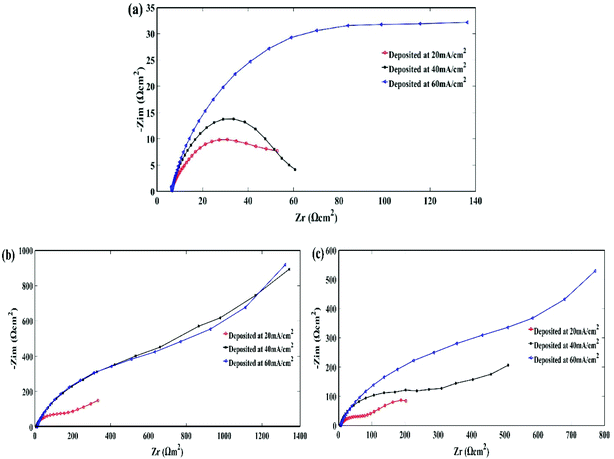
The Electrochemical Impedance Spectroscopy (EIS) measurement is used as a corrosion resistance technique to evaluate the characteristics and kinetics of the electrochemical process prevailing at the electrode/solution interface in corrosive solutions.42,43 The EIS measurements were carried out by the deposition of citrate and non-citrate baths in a 3.5% NaCl solution to calculate the corrosion resistance behaviour of Zn–Ni coatings. The OCP's range of frequency was 100 kHz to 100 mHz, the amplitude was 10 mV, and the scan rate was 10 mV s−1. The measured EIS data are displayed as Nyquist plots and typical Bode plots in Fig. 8–10. In the Nyquist plots, the polarization resistance resembles the shape of a semicircle.8,37 All the impedance obtained at different current densities are shown in Fig. 8. The EIS measurement of the pure Zn coating deposited from the non-citrate bath exhibited a smaller impedance modulus. However, the Zn–Ni alloy coating deposited from the citrate bath showed a higher impedance modulus than the Zn–Ni alloy deposited from the non-citrate bath at 20 mA cm−2. The best coating with the maximum impedance modulus was found at 60 mA cm−2 for sample (b), as shown in Fig. 2(b). The worst coating with the least impedance modulus was found at 20 mA cm−2 for the pure Zn coating as shown in Fig. 8(a), and it is related to a little arc at high frequencies, forming the oxide film in air.44The optimal results of the Nyquist plot at 60 mA cm−2 current density are shown in Fig. 9. The equivalent electrical circuit can explicate the corrosion resistance of the present Zn–Ni alloy coating circuit. The electrical circuits are shown in Fig. 11, where Rsol represents the solution/electrolyte resistance between the reference and the working electrode (i.e., Zn–Ni coated specimen). R3 and CPE3 correspond to the resistance and capacitance of the formation of the thin oxide film that is reinforced by the ionic conduction through its pores. R2 and CPE2 correspond to the resistance and capacitance of the pure Zn and Zn–Ni alloy films. R1 represents the charge transfer resistance associated with the reaction of zinc oxide and reduction of oxygen. CPE1 corresponds to the electric double layer capacitance at the interface of the coating/electrolyte solution.28
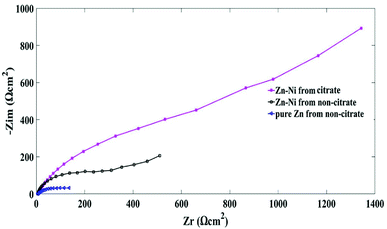 | ||
| Fig. 9 Nyquist plot for the pure Zn and Zn–Ni alloy coatings deposited from citrate and non-citrate baths. | ||
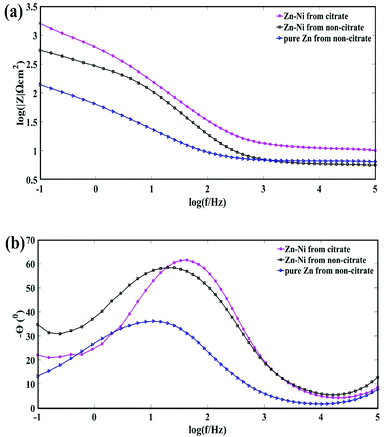 | ||
Fig. 10 Bode plots for the pure Zn and Zn–Ni alloy coatings deposited from citrate and non-citrate baths; (a) log modulus Z vs. log![[thin space (1/6-em)]](https://www.rsc.org/images/entities/char_2009.gif) f; (b) phase angle vs. log f; (b) phase angle vs. log![[thin space (1/6-em)]](https://www.rsc.org/images/entities/char_2009.gif) f. f. | ||
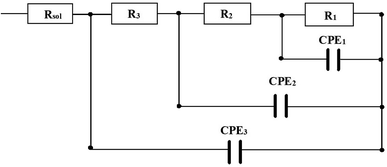 | ||
| Fig. 11 Electrical equivalent circuit modelling used for the simulation of EIS data of pure Zn and Zn–Ni alloy coating deposited from citrate and non-citrate baths. | ||
The mathematical equation for the impedance of constant phase element (CPE) is given below:45
| Z(Q) = y0−1(jw)−α |
All the measured impedance values were fitted using the Zahner Thales software. The calculated fit data of the electrical equivalent circuit deposited from citrate and non-citrate baths for the pure Zn and Zn–Ni alloy coating are shown in Table 5. The charge transfer resistance (R1) of the pure Zn coating was 55.6 Ω cm2, whereas, for the Zn–Ni coating deposited from the citrate bath, it was 3.6 kΩ cm2 and for the non-citrate Zn–Ni alloy sample, the value was 688.6 Ω cm2. This illustrates that the higher oxide reduction and zinc oxide reaction occurring on the Zn–Ni coated surface deposited from citrate bath, and the lower R1 value, are due to the increase of the active surface, which is related to the discontinuity and porosity of the coated film. It is well known that higher polarization resistance (R1) values indicate better corrosion resistance. The coating resistance (R2) of Zn–Ni from the citrate bath is 879 Ω cm2, from the non-citrate bath is 264.7 Ω cm2, and pure Zn coating from the non-citrate bath is 67.65 Ω cm2. The decrease in R1 from Zn–Ni to pure Zn from the citrate to non-citrate bath indicates the easier access of the electrolyte on the pure Zn coated surface deposited from the non-citrate baths. Moreover, the pure Zn coating deposited from the non-citrate bath had the lowest R1 and R2, which means that the electrolyte molecules that diffused into the coating surface exhibited less corrosion resistance. In the initial measurement, the low-frequency capacitive magnitude was less because there was a smaller effect of corrosive media on the working electrode and thus the obtained impedance response was purely due to the coated surface. As a result, the Zn–Ni alloy from the citrate bath had a maximum coating resistance (R2) with a minimum capacitance (CPE2) of 879 Ω cm2 and 28.2 μF cm2. The similar electrical equivalent circuit was reported by Feng et al. (2016) who prepared a Zn–Ni alloy coating from a new DMH-based bath as a replacement for Zn and Cd coatings.24 This behaviour indicates that the addition of the complexing agent (K3(C6H5O7)) in a bath is a simple and effective process to improve the corrosion resistance of the Zn–Ni alloy coating.
| Bath condition | Rsol (Ωcm2) | R1 (Ω cm2) | R2 (Ω cm2) | R3 (Ω cm2) | CPE1 (μFα cm2) | CPE2 (μFα cm2) | CPE3 (nFα cm2) |
|---|---|---|---|---|---|---|---|
| Pure Zn from non-citrate | 3.06 | 55.6 | 67.65 | 3.5 | 893.3, α = 0.761 | 173.5, α = 0.712 | 61.3, α = 1.0 |
| Zn–Ni from non-citrate | 2.62 | 688.6 | 264.7 | 3.3 | 105.5, α = 0.599 | 63.7, α = 0.858 | 104.0, α = 1.0 |
| Zn–Ni from citrate | 3.08 | 3.6K | 879 | 4.2 | 39.8, α = 0.626 | 28.2, α = 0.766 | 98.3, α = 1.0 |
As seen in the Bode plot, in the view of impedance vs. frequency, the impedance value increased on adding the potassium citrate. As for Bode plots of frequency vs. phase angle, the phase angle also increased from the citrate bath, as shown in Fig. 10(a) and (b).
4.7 Vickers microhardness test
The Vickers microhardness values obtained from different bath conditions of pure Zn and Zn–Ni alloy coatings electrodeposited on steel are shown in Fig. 12. The development of film microhardness showed an increase from 154 HV for the pure coating from the non-citrate (sample (a) to 223 HV sample (b)) prepared from the citrate bath. It was concluded that the microhardness was affected by the deposition of Zn–Ni from the citrate bath. Thus, the crystallite size is a significant variable that affects the hardness value.46,47 The smaller grain size suggests that there is a more substantial amount of grain boundaries that obstruct the dislocation motion and then create harder materials.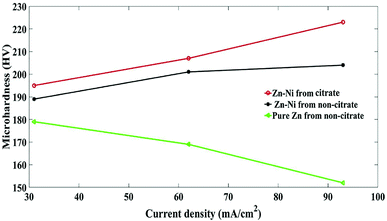 | ||
| Fig. 12 Vickers microhardness of pure Zn and Zn–Ni alloy electrodeposited on steel from different baths. | ||
5. Conclusions
The electrochemical behaviour of pure Zn and Zn–Ni alloy coatings from citrate and non-citrate baths and the stability of the electrolyte baths have been studied in this work. According to the above analysis, the following conclusions can be made:• Stabilized plating baths and complexing agents such as potassium citrate can be employed for Zn–Ni alloy electrodeposition. This extends the precipitation of Ni(OH)2 and Zn(OH)2 to a higher pH and the hydrogen evolution reaction is suppressed.
• The potentiodynamic polarization results reveal that the sample (b) coating possesses a lower Icorr value and a more positive corrosion potential than the other two coated samples. The smallest Icorr is due to the stable citrate bath Zn–Ni coated samples with decreased HER, which exhibited uniform and higher corrosion resistance and the SEM images showed the formation of denser and more uniform coating. The phase structure of the Zn–Ni deposits from the citrate bath had the highest intensity of the γ-phase (γ-NiZn3) (815), and the γ-Ni2Zn11 (330) (631) plane orientation exhibited better corrosion resistance.
• The EIS measurement of the sample (b) deposited from the citrate bath showed higher impedance modulus than the other coated samples. Further EIS measurements carried out for sample (a) and sample (c) deposited in the non-citrate bath showed lower impedance moduli in comparison to sample (b). The best coating with the maximum impedance modulus was found at 60 mA cm−2 for sample (b). The electrical equivalent circuit modelling data best fit the generated Nyquist plot and demonstrated that the Zn–Ni alloy coating on a steel substrate deposited from the citrate bath had maximum coating resistance (R2) with minimum capacitance (CPE2). This behaviour indicates that the addition of the complexing agent (K3(C6H5O7)) to a bath is a simple and effective process to improve the corrosion resistance of Zn–Ni alloy coating.
• Higher current density also leads to reduced grain size and provides a stronger, less coarse and more uniform coating. The development of film microhardness showed an increase in the hardness from 154 HV for pure Zn (sample (a)) and 223 HV for the Zn–Ni coating deposited from a non-citrate (sample (c)) to (sample (b)) that prepared from a citrate bath.
Conflicts of interest
There is no conflicts to declare.References
- T. V. Venkatesha, S. K. Rajappa and B. M. Praveen, Chemical treatment of zinc surface and its corrosion inhibition studies, Bull. Mater. Sci., 2008, 31(1), 37–41 CrossRef.
- C. C. Lin and C. M. Huang, Zinc-nickel alloy coatings electrodeposited by pulse current and their corrosion behavior, J. Coat. Technol. Res., 2006, 3(2), 99–104 CrossRef.
- V. G. Roev, R. A. Kaidrikov and A. B. Khakimullin, Zinc – Nickel Electroplating from Alkaline Electrolytes Containing Amino Compounds, Russ. J. Electrochem., 2001, 37(7), 756–759 CrossRef.
- D. Blejan, D. Bogdan, M. Pop, A. V. Pop and L. M. Muresan, Structure, morphology and corrosion resistance of Zn-Ni-TiO2 composite coatings, Optoelectron. Adv. Mater., Rapid Commun., 2011, 5(1), 25–29 Search PubMed.
- R. Fratesi, G. Roventi, G. Giuliani and C. R. Tomachuk, Zinc-cobalt alloy electrodeposition from chloride baths, J. Appl. Electrochem., 1997, 27(9), 1088–1094 CrossRef.
- I. H. Karahan and H. S. Güder, Electrodeposition and properties of Zn, Zn–Ni, Zn–Fe and Zn–Fe–Ni alloys from acidic chloride–sulphate electrolytes, Trans. IMF, 2009, 87(3), 155–158 CrossRef.
- K. R. Sriraman, S. Brahimi, J. A. Szpunar, J. H. Osborne and S. Yue, Characterization of corrosion resistance of electrodeposited Zn-Ni Zn and Cd coatings, Electrochim. Acta, 2013, 105, 314–323 CrossRef.
- A. Tozar and I. H. Karahan, Structural and corrosion protection properties of electrochemically deposited nano-sized Zn-Ni alloy coatings, Appl. Surf. Sci., 2014, 318, 15–23 CrossRef.
- R. Gnanamuthu, S. Mohan, G. Saravanan and C. W. Lee, Comparative study on structure, corrosion and hardness of Zn-Ni alloy deposition on AISI 347 steel aircraft material, J. Alloys Compd., 2012, 513, 449–454 CrossRef.
- F. L. G. Silva, D. C. B. Do Lago, E. D’Elia and L. F. Senna, Electrodeposition of Cu-Zn alloy coatings from citrate baths containing benzotriazole and cysteine as additives, J. Appl. Electrochem., 2010, 40(11), 2013–2022 CrossRef.
- F. Ebrahimi and H. Li, Structure and properties of electrodeposited nanocrystalline FCC Ni-Fe alloys, Mater. Sci. Eng., A, 2003, 347, 93 CrossRef.
- W. Schwarzacher, Electrodeposition: A Technology for the Future, Electrochem. Soc. Interface, 2006, 15(1), 32–35 Search PubMed.
- F. H. Assaf, S. S. Abd El Rehim, A. S. Mohamed and A. M. Zaky, Electroplating of brass from citrate-based alloy baths, Indian J. Chem. Technol., 1995, 2(3), 147–152 Search PubMed.
- R. Rastogi and A. Pandey, Electrolytic deposition of Zn-Mn-Mo alloys from a citrate bath, Indian J. Chem. Technol., 2010, 17(5), 381–385 Search PubMed.
- M. J. Rahman, S. R. Sen, M. Moniruzzaman and K. M. Shorowordi, Morphology and Properties of Electrodeposited Zn-Ni Alloy Coatings on Mild Steel, Journal of Mechanical Engineering, 2009, 40(1), 9–14 Search PubMed.
- H. Faid, L. Mentar, M. R. Khelladi and A. Azizi, Deposition potential effect on surface properties of Zn–Ni coatings, Surf. Eng., 2017, 33(7), 529–535 CrossRef.
- M. V Tomić, M. M. Bučko, M. G. Pavlović and J. B. Bajat, Corrosion Stability of Electrochemically Deposited Zn-Mn Alloy Coatings, Surf. Interface Anal., 2010, 1, 87–93 Search PubMed.
- Y. F. Jiang, L. F. Liu, C. Q. Zhai, Y. P. Zhu and W. J. Ding, Corrosion behavior of pulse-plated Zn-Ni alloy coatings on AZ91 magnesium alloy in alkaline solutions, Thin Solid Films, 2005, 484(1–2), 232–237 CrossRef.
- J. R. Garcia, D. C. B. do Lago and L. F. de Senna, Electrodeposition of Cobalt Rich Zn-Co alloy Coatings from Citrate Bath, Mater. Res., 2014, 17(4), 947–957 CrossRef.
- A. Conde, M. A. Arenas and J. J. de Damborenea, Electrodeposition of Zn-Ni coatings as Cd replacement for corrosion protection of high strength steel, Corros. Sci., 2011, 53(4), 1489–1497 CrossRef.
- H.-H. Huang, The Eh-pH Diagram and Its Advances, Metals, 2016, 6(3), 23 CrossRef.
- A. Patterson, The Scherrer formula for X-ray particle size determination, Phys. Rev., 1939, 56, 978–982 CrossRef.
- A. M. El-Sherik, U. Erb and J. Page, Microstructural evolution in pulse plated nickel electrodeposits, Surf. Coat. Technol., 1997, 88(1–3), 70–78 CrossRef.
- Z. Feng, M. An, L. Ren, J. Zhang, P. Yang and Z. Chen, Corrosion mechanism of nanocrystalline Zn–Ni alloys obtained from a new DMH-based bath as a replacement for Zn and Cd coatings, RSC Adv., 2016, 6(69), 64726–64740 RSC.
- L. E. Moron, et al., Electrodeposition and corrosion behavior of Zn coatings formed using as brighteners arene additives of different structure, Surf. Coat. Technol., 2011, 205, 4985–4992 CrossRef.
- Z. Feng, Q. Li, J. Zhang, P. Yang, H. Song and M. An, Electrodeposition of nanocrystalline Zn-Ni coatings with single gamma phase from an alkaline bath, Surf. Coat. Technol., 2015, 270, 47–56 CrossRef.
- H. Jie, Q. Xu, L. Wei and Y. Min, Etching and heating treatment combined approach for superhydrophobic surface on brass substrates and the consequent corrosion resistance, Corros. Sci., 2016, 102, 251–258 CrossRef.
- Z. Feng, Q. Li, J. Zhang, P. Yang and M. An, Electrochemical Behaviors and Properties of Zn-Ni Alloys Obtained from Alkaline Non-Cyanide Bath Using 5,5’-Dimethylhydantoin as Complexing Agent, J. Electrochem. Soc., 2015, 162(9), D412–D422 CrossRef.
- M. G. Hosseini, H. Ashassi-Sorkhabi and H. A. Y. Ghiasvand, Electrochemical studies of Zn-Ni alloy coatings from non-cyanide alkaline bath containing tartrate as complexing agent, Surf. Coat. Technol., 2008, 202(13), 2897–2904 CrossRef.
- Y. Lin and J. Selman, Electrodeposition of corrosion- resistant Ni-Zn alloy: I. Cyclic voltammetric study, J. Electrochem. Soc., 1993, 140, 1299–1303 CrossRef.
- Z. Feng, Q. Li, J. Zhang, P. Yang and M. An, Studies on the enhanced properties of nanocrystalline Zn–Ni coatings from a new alkaline bath due to electrolyte additives, RSC Adv., 2015, 5(72), 58199–58210 RSC.
- C. C. Hu and C. Y. Chang, Anodic stripping of zinc deposits for aqueous batteries: Effects of anions, additives, current densities, and plating modes, Mater. Chem. Phys., 2004, 86(1), 195–203 CrossRef.
- A. C. Cheung, O. Bretschger, F. Mansfeld and K. Nealson, FUEL127-performance of different strains of the genus Shewanella in a microbial fuel cell, Abstr. Pap. Am. Chem. Soc., 2007, 234 Search PubMed.
- S. Basavanna and Y. Naik, Electrochemical studies of Zn–Ni alloy coatings from acid chloride bath, J. Appl. Electrochem., 2009, 39, 1975–1982 CrossRef.
- E. Kus, K. Nealson and F. Mansfeld, The effect of different exposure conditions on the biofilm/copper interface, Corros. Sci., 2007, 49, 3421–3427 CrossRef.
- Y. Boonyongmaneerat, K. Saenapitak and S. Saengkiettiyut, Reverse pulse electrodeposition of Zn-Ni alloys from a chloride bath, J. Alloy. Compd., 2009, 487, 479–482 CrossRef.
- F. Mansfeld, H. Shih, C. H. Tsai and H. Greene, Analysis of EIS Data for Common Corrosion Processes, Am. Soc. Test. Mater., 1993, 1188, 37–53 Search PubMed.
- E. McCafferty, Validation of corrosion rates measured by the Tafel extrapolation method 3215, Corros. Sci., 2005, 47, 3202–3215 CrossRef.
- D. Gelman, D. Starosvetsky and Y. Ein-Eli, Copper corrosion mitigation by binary inhibitor compositions of potassium sorbate and benzotriazole, Corros. Sci., 2014, 82, 271–279 CrossRef.
- F. H. Assaf, A. M. A. El-Seidy, M. M. Abou-Krisha and A. A. Eissa, Electrodeposition and Characterization of Zn-Ni-Mn Alloy from Sulfate Bath: Influence of Current Density, Int. J. Electrochem. Sci., 2015, 10, 1–14 Search PubMed.
- M. M. Abou-Krisha, Effect of pH and current density on the electrodeposition of Zn-Ni-Fe alloys from a sulfate bath, J. Coat. Technol. Res., 2012, 9(6), 775–783 CrossRef.
- M. K. Punith Kumar, T. V. Venkatesha, M. K. Pavithra and A. N. Shetty, A Study on Corrosion Behavior of Electrodeposited Zn-Rutile TiO2 Composite Coatings, Synth. React. Inorg., Met.-Org., Nano-Met. Chem., 2012, 42(10), 1426–1434 CrossRef.
- S. Fashu, C. D. Gu, J. L. Zhang, M. L. Huang, X. L. Wang and J. P. Tu, Effect of EDTA and NH4Cl additives on electrodeposition of Zn-Ni films from choline chloride-based ionic liquid, Trans. Nonferrous Met. Soc. China, 2015, 25(6), 2054–2064 CrossRef.
- J. Winiarsiki, W. Tylus, K. Winiarska and B. Szczygiel, Understanding corrosion via corrosion products characterizatio: I. Case study of the role of Mg alloying in Zn-Mn coating on steel, Corros. Sci., 2009, 51, 1251–1262 CrossRef.
- F. Mansfeld, Recording and analysis of Ac impedance data for corrosion studies.1. Background and methods of analysis, Corrosion, 1981, 37, 301–307 CrossRef.
- A. Portinha, V. Teixeira, J. O. Carneiro, S. N. Dub, R. Shmegera and C. J. Tavares, Hard ZrO2/Al2O3 nanolaminated PVD coatings evaluated by nanoindentation, Surf. Coat. Technol., 2005, 200(1–4), 765–768 CrossRef.
- O. Hammami, L. Dhouibi, P. Berçot, E. M. Rezrazi and E. Triki, Study of Zn-Ni alloy coatings modified by Nano-SiO particles incorporation, Int. J. Corros., 2012, 2012, 1–8 CrossRef.
| This journal is © The Royal Society of Chemistry 2018 |


