 Open Access Article
Enhanced thermoelectric performance of CNT/P3HT composites with low CNT content†
Sanyin Qu *a,
Mengdi Wangab,
Yanling Chenab,
Qin Yao*a and
Lidong Chen
 ac
ac
aState Key Laboratory of High Performance Ceramics and Superfine Microstructure, CAS Key Laboratory of Materials for Energy Conversion, Shanghai Institute of Ceramics, Chinese Academy of Sciences, Shanghai 200050, China. E-mail: qusanyin@mail.sic.ac.cn; yaoqin@mail.sic.ac.cn
bUniversity of Chinese Academy of Sciences, Beijing 100049, China
cShanghai Institute of Materials Genome, Shanghai 200050, China
First published on 2nd October 2018
Abstract
Carbon nanotubes (CNTs) have emerged as one of the leading additives for improving the thermoelectric properties of organic materials due to their unique structure and excellent electronic transport properties. However, since as-grown CNTs generally possess different diameters, it is of high interest to determine the influence of the diameter of carbon nanotubes on the thermoelectric properties of CNT/poly(3-hexylthiophene) (P3HT) composite films. Herein, we prepared CNT/P3HT composite films with diameters of <8 nm, 8–15 nm, 20–30 nm, 30–50 nm and >50 nm and studied their thermoelectric properties. It was found that the diameter of CNTs had an important influence on the TE performance of the composite films. The P3HT-dCNT (<8 nm) and P3HT-dCNT (8–15 nm) composite films exhibited almost the same thermoelectric performance and almost more than double that of the other three composite films with increased CNT diameter. The different mass fractions of CNT/P3HT composite films have also been investigated. The maximum TE power factor of CNT (d < 8 nm)/P3HT composite films reached 49.0 μW mK−2 at the mass fraction of 95 wt% P3HT, that is, 5 wt% CNTs. This superior TE power factor of CNT (d < 8 nm)/P3HT composite films can be ascribed to the fully connected interlayer of the P3HT polymer and also the heterogeneous dispersion of short-length CNTs.
1. Introduction
Thermoelectric (TE) materials have great potential in applications such as power generation and solid-state heating/cooling, realizing direct conversion between thermal energy and electrical energy without involving moving mechanical components or hazardous working fluids. The performance of TE materials is characterized by a dimensionless figure of merit ZT = S2σT/κ, where S, σ, κ and T are the Seebeck coefficient, electrical conductivity, thermal conductivity and absolute temperature, respectively, and S2σ is the power factor. Conventional inorganic semiconductors such as Bi2Te3, PbTe and SiGe have received the most attention as TE materials because of their high power factors.1–5 However, the relatively high cost of raw materials and the lack of scalability of production for these conventional TE materials have created a great need for inexpensive and easily processed materials for expanding TE applications.In recent years, polymer-based composite TE materials have attracted increasing attention in thermoelectric research because of their low cost, mechanical flexibility and generally low thermal conductivity.6–18 Carbon nanotubes (CNTs) are the most commonly used and effective material among numerous fillers. CNTs can provide conductive paths when embedded in polymer matrix because CNTs possessed excellent electrical conductivity and high mobility. For example, Bounioux et al. used single-walled carbon nanotubes (SWNTs) as fillers to prepare SWNTs/P3HT composites and obtained a high electrical conductivity of ∼103 S cm−1 as the SWNTs formed a three-dimensional conductive network, resulting in a large TE power factor in the in-plane direction of the composites, ∼95 μW mK−2 at room temperature.12 Meanwhile, quasi one-dimensional structure of CNTs could be used as templates to induce highly ordered polymer molecular chain structures through the strong π–π conjugated interactions between CNTs and conjugated conducting polymers.19–22 Du et al.19 fabricated P3HT/CNT films by oxidative polymerization of 3-hexylthiophene in chloroform solution containing dispersed CNT. The P3HT chains were orderly attached onto the surface of the CNTs by the π–π conjugated interactions between CNTs and P3HT, which resulted in a reasonable thermoelectric performance with CNT content of 5 wt%. Yao et al.23,24 fabricated SWNTs/PANI composite TE materials and found that PANI molecular chains were orderly arranged on the surface of SWNTs by the π–π conjugated interactions between SWNTs and PANI, which facilitated the increase of carrier mobility and thereby improved the electronic transport properties of SWNTs/PANI composites.
Although the TE properties of organic materials can be largely enhanced by compounding SWNTs with polymer matrix and numerous CNTs/polymer composite TE materials have been prepared by all kinds of methods, the effect of physical properties of carbon nanotubes on the thermoelectric properties of CNTs/polymer composites have been rarely studied. Previously, Wang25 compared the TE properties of CNTs/polymer composites using metallic CNT and semi-conducting CNT, confirming that the semi-conducting CNT/polymer composites exhibited a much higher Seebeck coefficient than that of metallic CNT/polymer composites, attributed to the effective energy filtering effect at the interfaces between semi-conducting CNT and polymer. For carbon nanotubes, the diameter is another important physical properties. Blackburn and Ferguson studied the properties of semiconducting CNTs with different diameter by conjugated polymer wrapping process. The wrapping conjugated polymers are fluorine-based polymers. However, the CNTs extracted by polymers still contain a broad diameter range, while the diameter of the separated CNT was determined by average energy of the extracted CNTs calculated from absorbance spectra.26,27 Therefore, it is still not so clear about how the effect of CNT diameter on the thermoelectric properties of CNTs/polymer composites.
Generally, the chirality and diameter of SWNTs are uniquely specified by the vector, Ch = ma1 + na2, where m, n are integers and a1, a2 are the unit vectors of graphite, as shown in Fig. S1.†28–31 CNTs can be deemed to form by crimping a graphene sheet along the direction of the vector Ch. The diameter (d) and chiral angle (θ) can be calculated from the indices of n and m using the following equation:
Therefore, the different diameter of CNTs would lead to diverse electronic transport properties for CNTs/polymer composites. Thus, it is vital to clarify the effect of diameter of CNTs on the TE properties of CNTs/polymer composites.
Herein, we fabricated CNT/P3HT composite films with five different diameter of CNTs (d < 8 nm, 8–15 nm, 20–30 nm, 30–50 nm and >50 nm) and their TE properties were investigated. It was found that the diameter of CNTs had an important influence on the TE performance of the composite films. The P3HT-dCNT (<8 nm) and P3HT-dCNT (8–15 nm) composite films exhibited almost the same thermoelectric performance and almost more than twice times of the other three composite films with increased CNT diameter. The different mass fraction of CNT/P3HT composite films have also been investigated. The maximum TE power factor of CNT (d < 8 nm)/P3HT composite films reached 49.0 μW mK−2 at the mass fraction of 95 wt% P3HT, that is, 5 wt% CNT. This superior TE power factor of CNT (d < 8 nm)/P3HT composite films can be ascribed to the fully connected interlayer of P3HT polymer and also the heterogeneous dispersion of short-length CNTs.
2. Experiments
2.1. Materials
The CNTs (MWNT) with length of ∼1 μm and diameters of (1) <8 nm, (2) 8–15 nm, (3) 20–30 nm, (4) 30–50 nm, (5) >50 nm, were purchased from DK nano (Beijing, China). Regioregular P3HT (HT-P3HT, the percentage of molecules with the head-to-tail configuration is up to 98%) (Mw = 87 kg mol−1) was purchased from Sigma-Aldrich (Shanghai, China) and used as received. Trifluoromethanesulfonimide (CF3SO2)2NH (95%) was purchased from Aladdin (Shanghai, China). Analytical grade nitromethane (CH3NO2) was dried over CaCl2 before use. The dopant ferric bis(trifluoromethanesulfonyl)imide (Fe(TFSI)3) was synthesized by firstly treating Fe2(SO4)3 aqueous solution with NaHCO3 aqueous solution to get the precipitates, and then the precipitates was added into acid (CF3SO2)2NH in anhydrous CH3NO2 to obtain Fe(TFSI)3/CH3NO2 solvent.2.2. Synthesis of CNTs/P3HT composite films
First, carbon nanotubes (CNTs) were crudely dispersed in chloroform (CHCl3) by sonication (650 w) for 30 min. Then, regioregular P3HT was dissolved in CHCl3 (10 mg ml−1) and different volume of P3HT solution was gradually added into the CNTs/CHCl3 (0.05 mg ml−1) dispersion. After addition step, the mixed CNTs/polymer/CHCl3 dispersion was stirred for another 3 h at room temperature, resulting in homogeneous dispersion of CNTs. Subsequently, the well dispersed suspensions were dropped on glass substrates and dried at room temperature. Finally, the CNT/P3HT composite films were immersed into Fe(TFSI)3/CH3NO2 for 1 h. The doped CNT/P3HT composite films with different diameters and weight content of CNTs were obtained.2.3. Characterizations
The morphologies of all the CNTs, CNT/polymer composite films were characterized by scanning electron microscopy (SEM) (FEI Magellan 400). Raman spectra were collected to determine the ordering of CNTs from a Raman spectrometer (Thermo Scientific DXR) equipped with two different laser wavelengths (532 nm and 780 nm). The Grazing incidence X-ray diffraction (GIXRD) patterns of the films were examined by an X-ray diffractometer (Bruker D8 Advance) with an incidence angle of 1°. The in plane electrical conductivity and Seebeck coefficient of all films were measured at room temperature using a ZEM-5 instrument system (Advance Riko). The thickness of the films were detected on a Dektak profilometer. Typical thickness of the samples was 0.5–1 μm. The power factor was calculated from the corresponding Seebeck coefficient and electrical conductivity at room temperature.3. Results and discussion
3.1. Characterization of pure CNTs
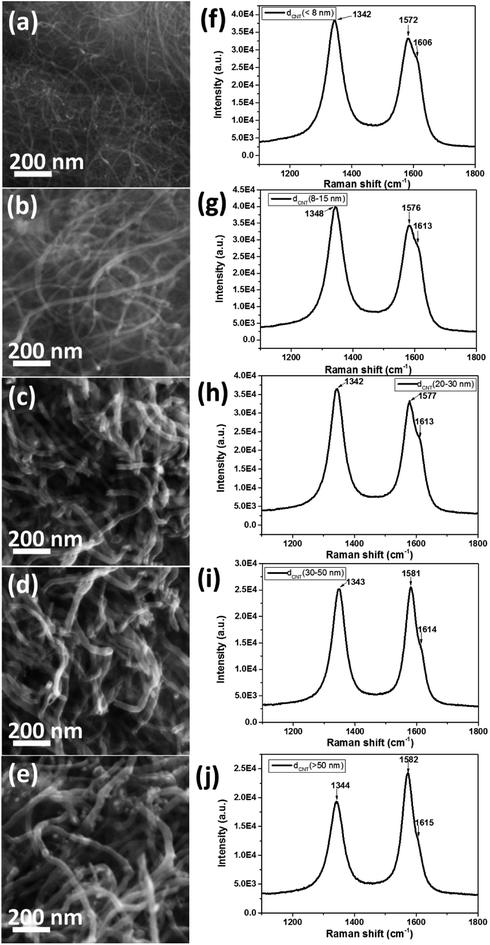
Fig. 1a–e shows the SEM images of pure CNTs with different diameter. The pure CNTs were uniformly separated with nearly few aggregation. The diameter of the CNTs was gradually increased from Fig. 1a–e. The CNT bundles showed partially disordered structures with diameter of less than 15 nm (Fig. 1a and b), while for the CNTs with diameter higher than 20 nm, the CNT bundles were displaying ordered and clear structure as shown in Fig. 1c–e. Fig. 1f–j presents the Raman spectra of the pure CNTs with different diameter. The spectra of pure CNTs show two strong peaks at ∼1580 cm−1 and ∼1340 cm−1, assigned to the G-band (in-plane stretching E2g mode) and D-band (defect or disorder induction mode), respectively.32The G-band spectra of all the CNTs consisted of one main peak and one shoulder peak. The main peak with lower frequency attributed to vibrations along the circumferential direction and the acromion peak with upper frequency associated with vibrations along the direction of the nanotube axis. The D-band attributed to defect or disorder induction mode was also observed in the Raman spectra. However, the G![[thin space (1/6-em)]](https://www.rsc.org/images/entities/char_2009.gif) :
:![[thin space (1/6-em)]](https://www.rsc.org/images/entities/char_2009.gif) D ratio was gradually increased from Fig. 1f–j, indicating increased ordering and less defects with increased diameter of the CNT.
D ratio was gradually increased from Fig. 1f–j, indicating increased ordering and less defects with increased diameter of the CNT.
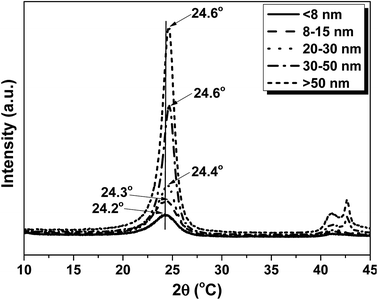
X-ray diffraction (XRD) of CNTs were characterized to give further evidence of the change in crystallinity for the CNTs with different diameter, as shown in Fig. 2. The samples show typical peak at 2θ = 24.2°, 24.3°, 24.4°, 24.6° and 24.6° for the dCNT (<8 nm), dCNT (8–15 nm), dCNT (20–30 nm), dCNT (30–50 nm) and dCNT (>50 nm), respectively. This peak was assigned to lattice plane (002), similar with the peak of graphite.33 The gradually upper shift of the peaks indicated that the CNTs have decreased interlayer spacing with increasing CNT diameter. Besides, the full width at half-maximum (FWHM) gradually decrease with increasing CNT diameter. This results also display increased ordering of the CNTs with increasing CNT diameter, as the FWHM always relates with the material ordering. Another typical peak at 2θ = 42° can also be observed for all the samples, which was assigned to lattice plane (100).33
3.2. Preparation and characterization of CNT/P3HT composite films with different CNT diameter
In order to improve the connectivity between the CNTs, we induced poly(3-hexylthiophene) (P3HT) to bridge the uniformly dispersed CNT bundles and CNT/P3HT composite films with different CNT diameter (dCNT (<8 nm), dCNT (8–15 nm), dCNT (20–30 nm), dCNT (30–50 nm) and dCNT (>50 nm)) were prepared. The CNT/P3HT composite films were synthesized based on the procedures described in Fig. 3. During this process, first the CNT was homogeneously dispersed in chloroform (CHCl3) through powerful sonication (650 w) for 0.5 h, and then the P3HT dissolved in CHCl3 was slowly added into the CNT/CHCl3 dispersion, keeping stirring for another 3 h. The color of the mixture solvents gradually change from dark to deep red when P3HT was added into the CNT dispersions. The P3HT chains were preliminary oriented on the surface of CNT by the π–π conjugation interactions between P3HT and CNT, providing less contact area between CNTs, therefore the CNT/P3HT can steadily dispersed in CHCl3 solvent. Subsequently, the well dispersed P3HT/CNT/CHCl3 suspensions were drop-casted onto the glass substrate and dried at room temperature. Finally, the CNT/P3HT composite films were immersed into solution of the dopant Fe(TFSI)3/CH3NO2 solvent for 1 h. The doped CNT/P3HT composite films with different diameters and weight content of CNTs were obtained. The SEM images of CNT/P3HT composite films with different CNT diameter were displayed in Fig. 4 (40 wt% CNT was selected). All the CNTs were well dispersed in the composite films. Meanwhile, the CNTs can be clearly observed in the SEM images and show gradually increased diameters.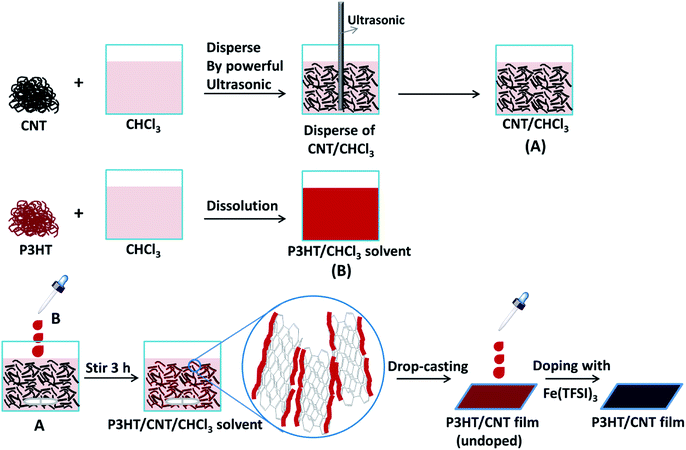 | ||
| Fig. 3 Schematic illustration of the synthesis procedure of P3HT/CNT composite films with different diameter or CNT content. | ||
 | ||
| Fig. 4 SEM images of P3HT/CNT composite films with diameter of (a) <8 nm; (b) 8–15 nm; (c) 20–30 nm; (d) 30–50 nm; (e) >50 nm. | ||
The Raman spectra of the CNT/P3HT composite films with different CNT diameter were measured, and the spectra of pure P3HT was also measured as comparison, as shown in Fig. 5. The assignments of all typical Raman peaks are listed in Table 1.34 For the pure P3HT film, all the typical peaks of the pure P3HT were observed. The spectra of the CNT/P3HT films show almost all the peaks of the pure P3HT film and the additional peak at ∼1340 cm−1 and ∼1570 cm−1 of the CNT can also be observed. The peak intensities at ∼1340 cm−1 and ∼1570 cm−1 of the CNT gradually increase with the increase of the CNT diameter, while the intensities at ∼1182 cm−1, ∼1209 cm−1 and ∼1445 cm−1 decrease on the other hand, suggesting an increase in the in-plane stretching of CNT and a decrease of C–C inter-ring stretch and symmetric C![[double bond, length as m-dash]](https://www.rsc.org/images/entities/char_e001.gif) C stretch of P3HT.
C stretch of P3HT.
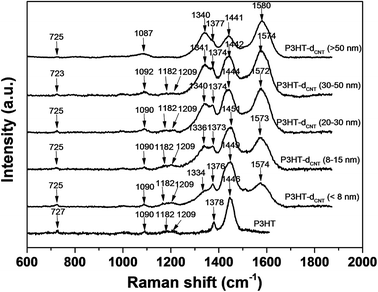 | ||
| Fig. 5 Raman shift of P3HT/CNT composite films with diameter of <8 nm; 8–15 nm; 20–30 nm; 30–50 nm; >50 nm. | ||
| Raman bands (cm−1) | Assignment |
|---|---|
| ∼1445 | Symmetric C![[double bond, length as m-dash]](https://www.rsc.org/images/entities/char_e001.gif) C stretch mode C stretch mode |
| ∼1381 | C–C intra-ring stretch mode |
| ∼1208 | Inter-ring C–C stretch mode |
| ∼1180 | C–H bending mode with C–C inter-ring stretch mode |
| ∼1090 | C–H bending |
| ∼728 | C–S–C deformation mode |
XRD spectra of P3HT/CNT composite films with different CNT diameter has also been measured and displayed in Fig. 6. The pure P3HT show three sharp peaks at 2θ = 5.3°, 10.7° and 16.1°, which are assigned to the repeat unit of hexyl chains ((100), (200) and (300) lattice planes). The broad peak at 2θ = 24.2° assigned to the repeat unit of π–π stacking of pure P3HT was not obvious in the figure. After composite of P3HT with different CNTs, there appears an obvious peak at 2θ = ∼24°, ascribed to the CNT peaks. However, the peak at 2θ = 42° of CNTs was not observed in all the P3HT/CNT composites. The peak intensities of P3HT-dCNT (<8 nm) and P3HT-dCNT (30–50 nm) composite films were low compared to other samples, ascribed to the high intensity of the (002) lattice planes of CNT. New peaks at lower 2θ degree were observed in the P3HT-dCNT (<8 nm) and P3HT-dCNT (>50 nm) composite films, which is due to two possible factors. One factor is the strong π–π interaction between the thiophene rings and CNT surface of the composite films. The π–π interaction between the thiophene rings and dCNT (<8 nm) is because of the small diameter increased the van der Waals force between the two subject. While the strong interaction between the thiophene rings and dCNT (>50 nm) is possibly because of the increased ordering of CNT surface, therefore improved the π–π conjugation length. The other possible factor is the effect of the side chains of the polymer. The interaction between P3HT and CNTs is strongly depends on CNT diameter during the polymer wrapping process.
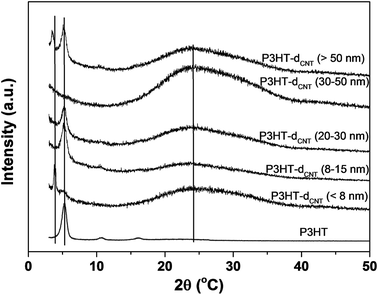 | ||
| Fig. 6 X-ray diffraction of P3HT/CNT composite films with diameter of <8 nm; 8–15 nm; 20–30 nm; 30–50 nm; >50 nm. | ||
The electrical conductivity (σ) and Seebeck coefficient (S) of P3HT/CNT composite films with different CNT diameters at room temperature were measured, and the results are shown in Fig. 7, with error bars. The average σ of the composite films are showing remarkable difference with different CNT diameters. The σ of P3HT-dCNT (<8 nm), P3HT-dCNT (8–15 nm), P3HT-dCNT (20–30 nm), P3HT-dCNT (30–50 nm) and P3HT-dCNT (>50 nm) composite films are 36.2 S cm−1, 33.4 S cm−1, 17.5 S cm−1, 11.6 S cm−1 and 2.7 S cm−1, respectively. The σ of the composite films are decreased with increasing CNT diameter. The S of the composite films are 27.8 μV K−1, 28.8 μV K−1, 30.6 μV K−1, 34.0 μV K−1 and 36.5 μV K−1, respectively, showing slight increasement with increasing CNT diameter. As a result, the power factor (PF) of the composite films are 2.8, 2.8, 1.6, 1.3 and 0.4 μW mK−2, respectively. The P3HT-dCNT (<8 nm) and P3HT-dCNT (8–15 nm) composite films exhibited almost the same thermoelectric performance, while the other three composite films show decreased thermoelectric performance with increased CNT diameter, owing to the deterioration of the electrical conductivity.
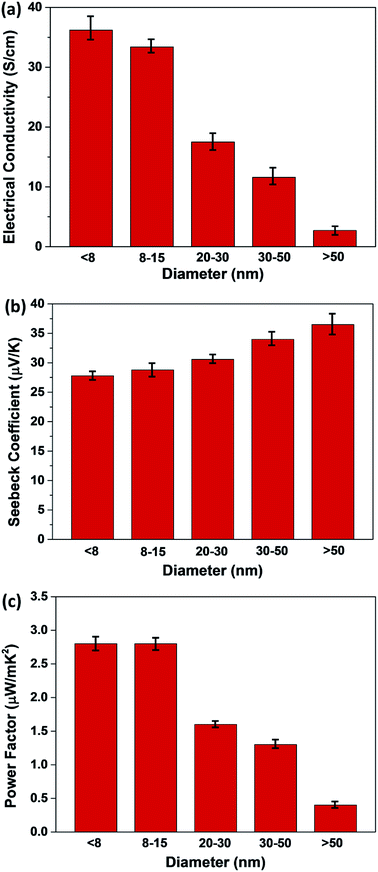 | ||
| Fig. 7 (a) Electrical conductivity, (b) Seebeck coefficient and (c) power factor of P3HT/CNT (40 wt% CNT) composite films with diameter of <8 nm, 8–15 nm, 20–30 nm, 30–50 nm and >50 nm. | ||
3.3. Preparation and characterization of CNT/P3HT composite films with different mass fraction of P3HT content
The CNT/P3HT composite films with 40 wt% CNT showed relatively low thermoelectric performance possibly because of insufficient electrical connection due to less composition of P3HT. Therefore, the different mass fraction of CNT/P3HT composite films have been prepared. In order to get improved properties of composites, we chose the CNT (d < 8 nm) and prepared the P3HT/CNT composite films with different P3HT content (0 wt%, 20 wt%, 40 wt%, 60 wt%, 80 wt%, 90 wt%, 95 wt% and 98 wt%). The SEM images of the composite films with different P3HT content (wt%) are shown in Fig. 8. The pure CNT film with 0 wt% P3HT was effectively dispersed with little connection. After composite with 20 wt% P3HT, some part showed aggregation of CNT bundles with P3HT, while the other part showed dispersed CNTs without enough connection. When the introduced polymer P3HT was increased to 40 wt%, 60 wt%, 80 wt% and 90 wt%, the aggregation bundles started to decrease gradually and showed better connection and more compact structure of the film. When further increased P3HT content to 95 wt% and 98 wt%, the CNTs were observed to be homogeneously dispersed into the composite films and with compact structure. The increasing content of P3HT improved the connectivity and accessary of the CNTs with short length.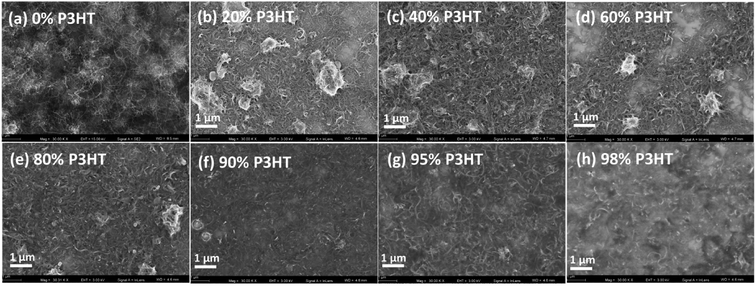 | ||
| Fig. 8 SEM images of P3HT/CNT (d < 8 nm) composite films with P3HT content (wt%) of 0 wt%, 20 wt%, 40 wt%, 60 wt%, 80 wt%, 90 wt%, 95 wt% and 98 wt%. | ||
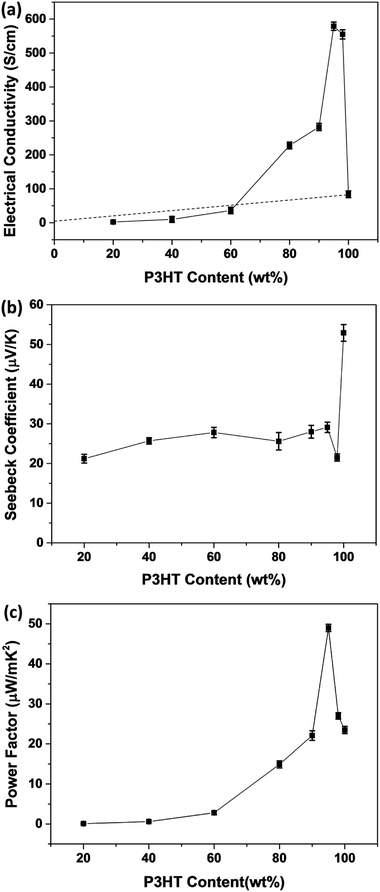
Fig. 9 presents the thermoelectric properties of P3HT/CNT composite films as a function of the mass fraction of P3HT at room temperature. The electrical conductivity increased with the increase of P3HT content, reaching the peak value of 579 S cm−1 for the sample with 95 wt% P3HT, then slightly decreased to 555 S cm−1 for the sample with 98 wt% P3HT. The electrical conductivity of pure P3HT was decreased to 84.1 S cm−1. While Seebeck coefficient of composites slightly increased from 21.2 μV K−1 to 29.1 μV K−1 and suddenly dropped to 21.5 μV K−1 at 98 wt% P3HT. The Seebeck coefficient of pure P3HT was increased to 52.9 μV K−1. The suddenly drops of Seebeck coefficient and electrical conductivity is possibly because of the less connection of the CNTs decrease the carrier mobility of the composites. Consequently, the highest power factor of the P3HT/CNT composite film was 49.0 μW mK−2 at the mass fraction of 95 wt% P3HT as shown in Fig. 9.
The theoretical electrical conductivity and Seebeck coefficient value of composite system are generally estimated based on either the series or parallel connected mixture models.35,36 For the P3HT/CNT system, the volume fraction of CNT and P3HT can be substituted by the weight fraction due to the similar density of CNT and P3HT. Thus, the electrical conductivity and Seebeck coefficient of the P3HT/CNT composite films can be calculated using the following expressions:37
| σ (parallel) = σP3HTVP3HT + σCNT (1 − VP3HT) |
where σ (parallel) and S (parallel) are the calculated electrical conductivity and Seebeck coefficient of the P3HT/CNT composite system based on the parallel connected mixture model. σP3HT and SP3HT are the electrical conductivity and Seebeck coefficient of the P3HT content. σCNT and SCNT are the electrical conductivity and Seebeck coefficient of the CNT content. VP3HT is the volume fraction of the P3HT.
The percolation theory is generally a reasonable tool to describe the insulator-to-conductor transitions in composites. The estimated electrical conductivity based on the parallel connected mixture model has been shown in the dashed line in Fig. 9a. Interestingly, it is shown that the experimental conductivity values of the P3HT/CNT composite film are firstly lower than those of calculated values when the P3HT content is smaller than 60 wt%, and then dramatically higher than those of calculated values with further increasing P3HT content.
In general, the percolation threshold is no more than 10 vol% in the CNT-based system due to its high aspect ratio for the long-length CNTs. However, in this CNT/P3HT composite films, the CNT is with short length of about only 1 μm. The CNT film without adding P3HT is of individual CNT or nanotube clusters isolated like the island, which prevents contact between the CNTs, showing insulator character of the pure CNT film, as seen in Fig. 10a. After introducing 20 wt% polymer P3HT into the CNTs, the electrical conductivity of the composite film can be observed but with low value. This is possibly because the aggregation of CNT bundles with P3HT only connect some part of the CNTs, while most of the other CNTs are still remained insulated clusters. When increasing the P3HT content to 40 wt% and 60 wt%, the electrical conductivity of composite films increased slowly, which is possibly because of the aggregation of CNT bundles with P3HT, letting the interlayer of P3HT polymer and CNT cannot be fully connected, as shown in Fig. 10c. When further increasing the P3HT content to 80 wt%, 90 wt% and 95 wt%, there is enough polymer chains to wrap around the CNTs, therefore the CNTs can be sufficiently debundle and disperse with P3HT wrapping around its tubes. The prepared CNT/P3HT composite films are therefore composed of fully dispersed CNTs with P3HT wrapping around its tubes, without aggregated CNT bundles, which can be proved by the SEM images shown in Fig. 8. The interlayer of P3HT polymer and CNT become fully connected into a network, which make the delocalization carriers spread over the entire network, enabling the rapid propagation of electrons along the π–π conjugated region, therefore the electrical conductivity was dramatically increased to the maximum value. And then there is a little bit decrease of the electrical conductivity probably because of the less connection again due to the decreased amount of CNTs.
4. Conclusions
In summary, we have demonstrated influence of diameter of CNTs on the TE performance of the composite films. The SEM, Raman and XRD analysis results showed that CNTs display increased ordering with increasing CNT diameter. Consequently, the P3HT-dCNT (<8 nm) and P3HT-dCNT (8–15 nm) composite films exhibited almost the same thermoelectric performance and almost more than twice times of the other three composite films with increased CNT diameter. The CNT/P3HT composite films with different mass fraction of CNT have been prepared. With the increasing of bridging material P3HT, the electrical conductivity increased gradually for the P3HT content from 40 wt% to 60 wt%, and then dramatically increased from 60 wt% to 95 wt%, reaching the maximum value of 579 S cm−1 for the sample with 95 wt% P3HT, that is, 5 wt% CNT. The interlayer of P3HT polymer and CNT become fully connected into a network, which make the delocalization carriers spread over the entire network, enabling the rapid propagation of electrons along the π–π conjugated region, therefore the power factor was dramatically increased to the maximum value of 49.0 μW mK−2 at the mass fraction of 5 wt% CNT.Conflicts of interest
There are no conflicts to declare.Acknowledgements
This research was funded by (International Cooperation Project of Ministry of Science and Technology grant) grant number (2017YFE0107800), (National Natural Science Foundation of China) grant number (No. 21602233, No. 51632010) and (a research grant from the Shanghai Government) grant number (No. 15JC1400301, No. 16ZR1414100).References
- L. Bell, Science, 2008, 321, 1457–1461 CrossRef CAS PubMed.
- A. Ioffe, Semiconductor Thermoelements and Thermo-electric Cooling, Infosearch Limited, London, UK, 1957 Search PubMed.
- R. Mehta, Y. Zhang, C. Karthik, B. Singh, R. Siegel, T. Tasciuc and G. Ramanath, Nat. Mater., 2012, 11, 233–240 CrossRef CAS PubMed.
- X. Tang, W. Xie, H. Li, W. Zhao, Q. Zhang and M. Niino, Appl. Phys. Lett., 2007, 90, 012102 CrossRef.
- H. Liu, X. Shi, F. Xu, L. Zhang, W. Zhang, L. Chen, Q. Li, C. Uher, T. Day and G. J. Snyder, Nat. Mater., 2012, 11, 422–425 CrossRef CAS PubMed.
- Q. Zhang, Y. Sun, W. Xu and D. Zhu, Adv. Mater., 2014, 26, 6829–6851 CrossRef CAS PubMed.
- Y. Chen, Y. Zhao and Z. Liang, Energy Environ. Sci., 2015, 8, 401–422 RSC.
- K. Shi, F. Zhang, C. Di, T. Yan, Y. Zou, X. Zhou, D. Zhu, J. Wang and J. Pei, J. Am. Chem. Soc., 2015, 137, 6979–6982 CrossRef CAS PubMed.
- H. Ju and J. Kim, ACS Nano, 2016, 10, 5730–5739 CrossRef CAS PubMed.
- N. Toshima, K. Oshima, H. Anno, T. Nishinaka, S. Ichikawa, A. Iwata and Y. Shiraishi, Adv. Mater., 2015, 27, 2246–2251 CrossRef CAS PubMed.
- R. Tian, C. Wan, Y. Wang, Q. Wei, T. Ishida and A. Yamamoto, J. Mater. Chem. A, 2016, 5, 564–570 RSC.
- C. Bounioux, P. Diaz-Chao, M. Campoy-Quiles, M. S. Martin-Gonzalez, A. R. Goni, R. Yerushalmi-Rozen and C. Muller, Energy Environ. Sci., 2013, 6, 918–925 RSC.
- Y. Wang, S. Zhang and Y. Deng, J. Mater. Chem. A, 2016, 4, 3554–3559 RSC.
- R. Wu, H. Yuan, C. Liu, J. Lan, X. Yang and Y. Lin, RSC Adv., 2018, 8, 26011 RSC.
- W. Shi, S. Qu, H. Chen, Y. Chen, Q. Yao and L. Chen, Angew. Chem., Int. Ed., 2018, 57, 8037–8042 CrossRef CAS PubMed.
- D. Huang, C. Wang, Y. Zou, X. Shen, Y. Zang, H. Shen, X. Gao, Y. Yi, W. Xu, C. Di and D. Zhu, Angew. Chem., Int. Ed., 2016, 55, 10672–10675 CrossRef CAS PubMed.
- C. Wan, R. Tian, M. Kondou, R. Yang, P. Zong and K. Koumoto, Nat. Commun., 2017, 8, 1024–1032 CrossRef PubMed.
- S. Qu, Q. Yao, L. Wang, Z. Chen, K. Xu, H. Zeng, W. Shi, T. Zhang, C. Uher and L. Chen, NPG Asia Mater., 2016, 8, e292 CrossRef CAS.
- Y. Du, S. Shen, W. Yang, S. Chen, Z. Qin, K. Cai and P. Casey, J. Electron. Mater., 2012, 41, 1436–1441 CrossRef CAS.
- Y. Du, S. Shen, W. Yang, K. Cai and P. Casey, Synth. Met., 2012, 162, 375–380 CrossRef CAS.
- C. T. Hong, W. Lee, Y. H. Kang, Y. Yoo, J. Ryu, S. Y. Cho and K.-S. Jang, J. Mater. Chem. A, 2015, 3, 12314 RSC.
- W. Lee, C. T. Hong, O. H. Kwon, Y. Yoo, Y. H. Kang, J. Y. Lee, S. Y. Cho and K.-S. Jang, ACS Appl. Mater. Interfaces, 2015, 7, 6550–6556 CrossRef CAS PubMed.
- Q. Yao, L. Chen, W. Zhang, S. Liufu and X. Chen, ACS Nano, 2010, 4, 2445–2451 CrossRef CAS PubMed.
- Q. Yao, Q. Wang, L. Wang and L. Chen, Energy Environ. Sci., 2014, 7, 3801–3807 RSC.
- L. Wang, Q. Yao, S. Qu, W. Shi and L. Chen, Org. Electron., 2016, 9, 146–152 CrossRef.
- A. D. Avery, B. H. Zhou, J. Lee, E. Lee, E. M. Miller, R. Ihly, D. Wesenberg, K. S. Mistry, S. L. Guillot, B. L. Zink, Y.-H. Kim, J. L. Blackburn and A. J. Ferguson, Nat. Energy, 2016, 1, 1–9 Search PubMed.
- B. A. MacLeod, N. J. Stanton, I. E. Gould, D. Wesenberg, R. Ihly, Z. R. Owczarczyk, K. E. Hurst, C. S. Fewox, C. N. Folmar, K. H. Hughes, B. L. Zink, J. L. Blackburn and A. J. Ferguson, Energy Environ. Sci., 2017, 10, 2168–2179 RSC.
- R. Saito, M. Fujita, G. Dresselhaus and M. S. Dresselhaus, Appl. Phys. Lett., 1992, 60, 2204–2206 CrossRef CAS.
- S. Reich and C. Thomsen, Phys. Rev. B, 2000, 62, 4273–4276 CrossRef CAS.
- M. S. Strano, C. A. Dyke, M. L. Usrey, P. W. Barone, M. J. Allen, H. W. Shan, C. Kittrell, R. H. Hauge, J. M. Tour and R. E. Smalley, Science, 2003, 301, 1519–1522 CrossRef CAS PubMed.
- H. Wang and Z. Bao, Nano Today, 2015, 10, 737–758 CrossRef CAS.
- M. S. Dresselhaus, G. Dresselhaus, A. Jorio, A. G. Souza and R. Saito, Carbon, 2002, 40, 2043–2061 CrossRef CAS.
- S. Basu-Dutt, M. L. Minus, R. Jain, D. Nepal and S. Kumar, J. Chem. Educ., 2012, 89, 221–229 CrossRef CAS.
- W. Tsoi, D. James, J. Kim, P. Nicholson, C. Murphy, D. Bradley, J. Nelson and J. Kim, J. Am. Chem. Soc., 2011, 133, 9834–9843 CrossRef CAS PubMed.
- Y. Gelbstein, J. Appl. Phys., 2009, 105, 023713 CrossRef.
- N. E. Coates, S. K. Yee and B. Mcculloch, et al., Adv. Mater., 2013, 25, 1629–1633 CrossRef CAS PubMed.
- L. Wang, Q. Yao, W. Shi, S. Qu and L. Chen, Mater. Chem. Front., 2017, 1, 741–748 RSC.
Footnote |
| † Electronic supplementary information (ESI) available. See DOI: 10.1039/c8ra07297c |
| This journal is © The Royal Society of Chemistry 2018 |


