 Open Access Article
Two-phase interface hydrothermal synthesis of binder-free SnS2/graphene flexible paper electrodes for high-performance Li-ion batteries†
Hao Wen,
Wenbin Kang,
Xingang Liu,
Wenjuan Li,
Liping Zhang and
Chuhong Zhang *
*
State Key Laboratory of Polymer Materials Engineering, Polymer Research Institute of Sichuan University, Chengdu 610065, China. E-mail: Chuhong.zhang@scu.edu.cn
First published on 30th July 2019
Abstract
Free-standing graphene-based composite paper electrodes with various active materials have attracted tremendous interest for next-generation lithium-ion batteries (LIBs) due to advantages such as their light weight, excellent mechanical flexibility, and superior electrochemical performance. However, despite its high theoretical energy density, SnS2 is rather difficult to composite with the graphene paper, because conventional reduction procedures for graphene oxide (GO) induce either decomposition or oxidation of SnS2. Herein, a novel solid/gas two-phase interface hydrothermal process is reported to fabricate flexible free-standing SnS2/graphene nanocomposite papers (SGP) assisted by a reducing and stabilizing agent thioacetamide aqueous solution. Such hydrothermal process not only successfully reduces SnS2/graphene oxide paper (SGOP) to SGP, but more importantly, keeps intact the paper configuration as well as the phase stability of SnS2. The as-prepared SGP electrode exhibits high reversible discharge capacity, outstanding cyclic stability and rate capability, which can be attributed to the synergistic effect of the conductive and flexible graphene matrix for accommodation of the volumetric changes of SnS2 upon cycling and the planar SnS2 nanospacers between the graphene layers introducing nanopores for penetration of electrolyte and inhibition of graphene nanosheets restacking. This report demonstrates a new strategy for more active materials with promising lithium storage properties joining the flexible graphene-based paper electrode family.
1. Introduction
Lithium-ion batteries (LIBs) are one of the most promising power sources for portable electronic devices and electric/hybrid vehicles due to their low cost, high energy density, excellent cyclic performance and environment-friendly nature.1,2 However, the limited lithium storage capacity of the widely used commercial graphite anode (372 mA h g−1) cannot meet the requirements for next-generation energy storage devices.3 Therefore, it is of utmost importance to explore alternative anode materials with high reversible capacities and excellent cyclic performance.Tin (Sn)-based anode materials, such as Sn, SnO2 and SnS2, have aroused a great deal of research interest due to their high theoretical specific capacities (645–992 mA h g−1) and low potential for Li+ intercalation (∼0.1 V (vs. Li/Li+)).4–6 Among Sn-based anode materials, SnS2 possesses a novel two-dimensional (2D) layered CdI2-type crystal structure, wherein Sn atoms are sandwiched between two layers of hexagonally packed sulfur atoms and the adjacent sulfur layers are connected by van der Waals forces.7,8 Thus, Li+ ions can easily intercalate into the layers of SnS2, offering many active sites and making it a promising host for lithium-ion storage. However, the low electronic conductivity and large volumetric changes (∼200%) during the charge/discharge process lead to inferior rate performance and poor cyclic stability, limiting the practical utilization of SnS2 in LIBs.8–10
There are two popular strategies to address the above-mentioned problems: synthesis of nanostructured SnS2 with different sizes and morphologies,11–16 such as nano-plates, nanosheets, microspheres, 3D-hierarchical structures, and fabrication of SnS2/carbonaceous nanocomposites by incorporating SnS2 with carbon-based nanostructures, such as carbon nanotubes and graphene.17–25 Among others, SnS2/graphene nanocomposites possess superior electrochemical performance owing to the high specific surface area, excellent electrical conductivity and exceptional flexibility of graphene nanosheets that accommodate the volumetric changes during charge/discharge process of SnS2.20–25
In addition to these merits, flexible free-standing graphene-based composite paper electrodes, which are light weight, and simple to manufacture for direct use as anode materials, have attracted great interests in recent years. It usually involves a three-step procedure: disperse active materials (such as SnO2, Si and Ag)26–30 or their precursors (such as SnCl2 and AgCH3COO)31,32 in graphene oxide (GO) to form a homogenous colloidal suspension, then filter under vacuum into a self-supported paper disc, followed by reduction GO to graphene. This approach has been widely applied to many active materials, such as SnO2, Co3O4 and Si, and significantly enhanced their capacity retention.26–33 However, there is rarely report on SnS2, and a few reasons are proposed: (1) unlike most of metal oxides where precursors only need to contain metal cations, in situ synthesis of sulphide is impractical, as sulfur sources S2− from such as thiourea (Tu) and thioacetamide (TAA), cannot be adsorbed to the GO nanosheets due to the electrostatic repulsion and hence cannot participate in the subsequent reaction after filtration. (2) If employing pre-synthesized SnS2 in the GO dispersion, it is hard to sustain the crystal stability of SnS2 when the filtered SnS2/GO paper (SGOP) to be further reduced: SnS2 will easily decompose into SnS and S under thermal reduction,9,34,35 or will turn into SnO2 under hydrothermal and solvothermal reduction if without a protection atmosphere.36,37 (3) Conventional hydrothermal and solvothermal reduction will also cause the graphene-based paper to dissemble in the solvents.38
Herein, we report the fabrication of a flexible free-standing SnS2/graphene paper electrode by a simple two-phase hydrothermal process at the solid/gas interface. Briefly, the filtered composite graphene oxide paper and thioacetamide aqueous solution are separately placed in a Teflon-lined autoclave. The thioacetamide aqueous solution plays dual roles of a reducing agent and a stabilizer. Hence, the proposed modified hydrothermal method successfully preserves both the mechanical integrity of the reduced SnS2/graphene paper electrode and the phase stability of the active material SnS2. The as-prepared composite paper electrode does not require conductive additives and current collectors etc., simplifying the LIB assembly process and rendering excellent lithium storage performance.
2. Experimental section
2.1 Synthesis of SnS2 nanocrystals
First, SnS2 nanocrystals were synthesized by using a hydrothermal method, as described elsewhere.39 Briefly, 10 mmol of SnCl4·5H2O (Chengdu Kelong Chemical Co., Ltd., China, 99%), 10 mmol of citric acid (Sigma-Aldrich, ≥99.7%) and 20 mmol of thioacetamide (Shanghai Aladdin Co., Ltd., China, 99%) were added into 80 mL of deionized (DI) water and stirred for 1 h. Then, the mixture was transferred into a 100 mL Teflon-lined autoclave and subjected to hydrothermal reaction at 130 °C for 12 h. The resultant SnS2 precipitates were filtered and alternatively washed several times with DI water and ethanol.2.2 Synthesis of SnS2/graphene paper
The as-prepared SnS2 nanocrystals were re-dispersed in DI water and dropwise added into a 0.8 mg mL−1 water suspension of graphene oxide (GO, Chang Zhou Sixth Element Material Technology Co., Ltd., China). The mixture with a weight ratio of 1![[thin space (1/6-em)]](https://www.rsc.org/images/entities/char_2009.gif) :
:![[thin space (1/6-em)]](https://www.rsc.org/images/entities/char_2009.gif) 1 between SnS2 and GO was ultrasonicated (300 W) for 1 h followed by vigorous stirring until a homogenous suspension was obtained. Then, the as-prepared suspension was vacuum filtered to produce a paper, which was carefully peeled-off from the filtration membrane. The flexible free-standing SnS2/graphene oxide paper (SGOP) was placed on the top of a small beaker, filled with thioacetamide aqueous solution (0.5 mol L−1), and hydrothermally reduced to SnS2/graphene paper (SGP) at 180 °C for 12 h inside an autoclave. For comparison, pure graphene paper (GP) was prepared following the same protocol, without SnS2. In another control sample, SGOP was reduced by replacing the thioacetamide aqueous solution with DI water.
1 between SnS2 and GO was ultrasonicated (300 W) for 1 h followed by vigorous stirring until a homogenous suspension was obtained. Then, the as-prepared suspension was vacuum filtered to produce a paper, which was carefully peeled-off from the filtration membrane. The flexible free-standing SnS2/graphene oxide paper (SGOP) was placed on the top of a small beaker, filled with thioacetamide aqueous solution (0.5 mol L−1), and hydrothermally reduced to SnS2/graphene paper (SGP) at 180 °C for 12 h inside an autoclave. For comparison, pure graphene paper (GP) was prepared following the same protocol, without SnS2. In another control sample, SGOP was reduced by replacing the thioacetamide aqueous solution with DI water.
2.3 Material characterization
The structure of the as-prepared SGP was analyzed by using X-ray diffractometer (XRD, Rigaku Smart Lab III) equipped with Cu Kα radiations. The XRD patterns were recorded in the 2θ range of 5–80° with a scan speed of 10° min−1. Raman spectra were collected by using a Raman spectroscopy (LabRAM HR) with a He–Ne laser (532 nm) as the excitation source. The morphology and microstructure of the as-prepared nanocomposites were examined by a field-emission scanning electron microscopy (FESEM, Quanta FEI) with energy-dispersive X-ray spectrometer (EDX) and transmission electron microscopy (TEM, Tecnai FEI).2.4 Electrochemical characterization
The SGP was directly employed as an anode electrode without adding any additives, whereas the SnS2 anode was fabricated by mixing SnS2 nanocrystals with carbon black and polyvinylidene fluoride (PVDF) in a weight ratio of 8![[thin space (1/6-em)]](https://www.rsc.org/images/entities/char_2009.gif) :
:![[thin space (1/6-em)]](https://www.rsc.org/images/entities/char_2009.gif) 1
1![[thin space (1/6-em)]](https://www.rsc.org/images/entities/char_2009.gif) :
:![[thin space (1/6-em)]](https://www.rsc.org/images/entities/char_2009.gif) 1 by using N-methyl-2-pyrrolidone (NMP) as the solvent, which resulted in a homogenous slurry. The as-obtained slurry was cast onto a Cu foil and vacuum dried at 120 °C for 12 h. Subsequently, CR2032 type half coin-cells were assembled in an argon-filled glove box by using SGP (or SnS2) as the working electrode, Li foil as the counter electrode, porous polypropylene membrane (Celgard-2300) as the separator and 1 M LiPF6, dissolved in 1
1 by using N-methyl-2-pyrrolidone (NMP) as the solvent, which resulted in a homogenous slurry. The as-obtained slurry was cast onto a Cu foil and vacuum dried at 120 °C for 12 h. Subsequently, CR2032 type half coin-cells were assembled in an argon-filled glove box by using SGP (or SnS2) as the working electrode, Li foil as the counter electrode, porous polypropylene membrane (Celgard-2300) as the separator and 1 M LiPF6, dissolved in 1![[thin space (1/6-em)]](https://www.rsc.org/images/entities/char_2009.gif) :
:![[thin space (1/6-em)]](https://www.rsc.org/images/entities/char_2009.gif) 1 (v/v) mixture of ethylene carbonate (EC) and dimethyl carbonate (DMC), as the electrolyte. The galvanostatic charge/discharge cycling measurements were carried out at various current densities in a voltage range of 0.01–3.00 V (vs. Li/Li+) using an automatic battery testing system (Land CT2001A). The cyclic voltammetry (CV) was carried out in a voltage range of 0.01–3.00 V (vs. Li/Li+) at a scan rate of 0.1 mV s−1. The electrochemical impedance spectroscopy (EIS) was carried out by using Biologic VMP3 electrochemical workstation by applying an AC voltage amplitude of 5 mV in the frequency range of 0.01 Hz to 100 kHz. The same coin cells were measured in situ before and after charge/discharge cycling. Full cells with SGP as the anode and commercial LiFePO4 as the cathode were also fabricated. The LiFePO4 electrode was prepared by the traditional coating method, i.e., the slurry containing 8
1 (v/v) mixture of ethylene carbonate (EC) and dimethyl carbonate (DMC), as the electrolyte. The galvanostatic charge/discharge cycling measurements were carried out at various current densities in a voltage range of 0.01–3.00 V (vs. Li/Li+) using an automatic battery testing system (Land CT2001A). The cyclic voltammetry (CV) was carried out in a voltage range of 0.01–3.00 V (vs. Li/Li+) at a scan rate of 0.1 mV s−1. The electrochemical impedance spectroscopy (EIS) was carried out by using Biologic VMP3 electrochemical workstation by applying an AC voltage amplitude of 5 mV in the frequency range of 0.01 Hz to 100 kHz. The same coin cells were measured in situ before and after charge/discharge cycling. Full cells with SGP as the anode and commercial LiFePO4 as the cathode were also fabricated. The LiFePO4 electrode was prepared by the traditional coating method, i.e., the slurry containing 8![[thin space (1/6-em)]](https://www.rsc.org/images/entities/char_2009.gif) :
:![[thin space (1/6-em)]](https://www.rsc.org/images/entities/char_2009.gif) 1
1![[thin space (1/6-em)]](https://www.rsc.org/images/entities/char_2009.gif) :
:![[thin space (1/6-em)]](https://www.rsc.org/images/entities/char_2009.gif) 1 ratio of active material
1 ratio of active material![[thin space (1/6-em)]](https://www.rsc.org/images/entities/char_2009.gif) :
:![[thin space (1/6-em)]](https://www.rsc.org/images/entities/char_2009.gif) carbon black
carbon black![[thin space (1/6-em)]](https://www.rsc.org/images/entities/char_2009.gif) :
:![[thin space (1/6-em)]](https://www.rsc.org/images/entities/char_2009.gif) PVDF was cast onto a Al foil and vacuum dried at 120 °C for 12 h. Whereas the SGP was directly used as the electrode and electrochemically pre-treated in a half cell for two galvanostatic cycles before being assembled into the full coin-cell. The galvanostatic charge/discharge cycling measurement were conducted on the full cells at various current densities in a voltage range of 2.0–4.5 V (vs. Li/Li+).
PVDF was cast onto a Al foil and vacuum dried at 120 °C for 12 h. Whereas the SGP was directly used as the electrode and electrochemically pre-treated in a half cell for two galvanostatic cycles before being assembled into the full coin-cell. The galvanostatic charge/discharge cycling measurement were conducted on the full cells at various current densities in a voltage range of 2.0–4.5 V (vs. Li/Li+).
3. Results and discussion
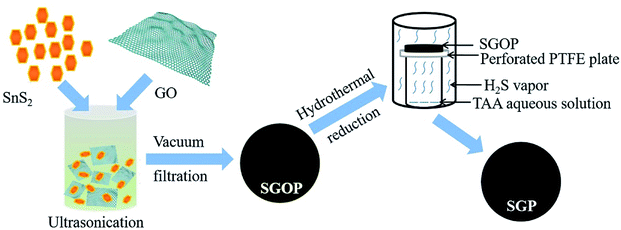
The detailed synthesis process is schematically illustrated in Fig. 1. First, SnS2 nanocrystals are uniformly dispersed in GO suspension by ultrasonication; then, the stable and homogeneous suspension is vacuum filtered to obtain a free-standing semi-transparent brownish thin film, SGOP; finally, the SGOP is hydrothermally reduced to form SGP using thioacetamide as a reducing agent. The mild reaction at the solid/gas interface guarantees the success of the fabrication of a flexible free-standing SGP: (1) the mechanical integrity and flexibility of SGP can be well maintained by means of avoiding the direct contact between the SGOP and the solvent in the autoclave; (2) SnS2 remains stable in the presence of H2S vapor released from thioacetamide without converting to SnO2 when hydrothermally reducing GO or decomposing to SnS under hydrothermal reduction condition.Fig. 2 presents the digital photographs of the nanocomposite paper before and after hydrothermal reduction. The SGOP exhibits a translucent brown-colored thin film after peeling from the filtration membrane (Fig. 2a). It is converted into a dark-black shinning SGP without visible shrinkage after hydrothermally reduced at 180 °C (Fig. 2b). Moreover, the SGP demonstrates excellent flexibility, as shown in the inset of Fig. 2b, enabling its direct utilization as a binder-free electrode in LIBs.
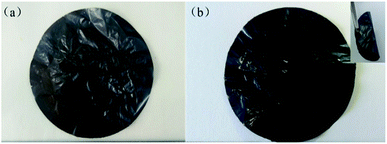 | ||
| Fig. 2 Digital photographs of the nanocomposite paper (a) before and (b) after hydrothermal reduction (inset: twisted GSP showing good flexibility). | ||
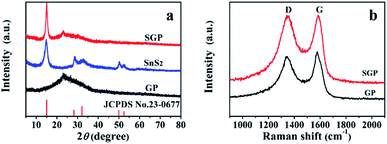
The XRD patterns of pristine SnS2 nanocrystals, GP and SGP are presented in Fig. 3a. The as-prepared pristine SnS2 nanocrystals do not contain any impurities and its XRD pattern is consistent with the standard XRD pattern of SnS2 (JCPDS card no. 23-0677). The broad diffraction peaks suggest a small particle size of SnS2. By using Scherrer's equation and calculating from (001) diffraction peak located at 2θ = 15.02°, an average size of 6.6 nm is determined. It is obvious that the (001) diffraction peak of SnS2 in SGP becomes sharper and stronger due to the facilitated growth of SnS2 on graphene during the hydrothermal reaction. The SnS2 particle size in the SGP is estimated to be ∼20–25 nm. The absence of the characteristic peak, corresponding to the (002) reflection of GO (2θ = 10°), confirms the successful reduction of GO paper. At the same time, a broad diffraction peak, corresponding to (002) planes of graphene, is observed at 2θ = 22.93°. One should note that the (002) peak of graphene in the composite shifts towards a lower angle as compared to pure GP (2θ = 23.33°), indicating that the SnS2 nanocrystals accommodated between the graphene nanosheets results in a small expansion of the interlayer distance, or in other words, d-spacing increases from 3.72 Å to 3.88 Å due to the incorporation of SnS2 nanocrystals. The XRD pattern of the nanocomposite paper, prepared by replacing the thioacetamide aqueous solution with DI water, is completely different from the as-prepared SGP (Fig. S1†). Once DI water is used as a reducing agent for GO, SnS2 phase changes to SnO2 (JCPDS card no. 41-1445). This illustrates the indispensability of using thioacetamide in the two-phase interface hydrothermal reduction reaction.
The Raman spectra of the pure GP and SGP are displayed in Fig. 3b. The Raman spectrum of SGP presents a prominent G-band (graphite carbon band) at 1584 cm−1 corresponding to the in-plane vibrations of sp2 carbon atoms, and the D-band (disordered carbon band) at 1341 cm−1, attributed to the edges and defects of the graphene sheets. In general, the peak intensity ratio of D-band and G-band (ID/IG) is related to the degree of disorder and the average size of sp2 domains.40 As shown in Fig. 3b, SGP shows a slightly higher ID/IG value of 1.04 than pure GP (0.92), which could be ascribed to the increased defects in graphene sheets due to the intervention of SnS2 nanocrystals.
The microstructure and morphology of SGP are further characterized by FESEM and TEM. Fig. 4a and b shows the top-view SEM images of the SGP, exhibiting wrinkles and ravines in graphene sheets with embedded SnS2 nanoparticles. Fig. 4c and d is the cross-section view of the SGP, demonstrating a typical two-dimensional (2D) layered structure with a thickness of ∼3 μm. As shown in high-magnification SEM image in Fig. 4d, a large number of voids and pores have also been observed in SGP between the graphene sheets, which might be introduced by the intercalation of the SnS2 nanocrystals. In contrast to the pure GP where graphene nanosheets tightly stack (Fig. S2†), the existence of voids and pores in SGP is beneficial for electrolyte access and leads to improved cyclic performance. The element composition and distribution of the SGP are further confirmed by FESEM-EDX analysis. As shown in Fig. S3,† The SGP is composed of Sn, S, C and O elements, which are homogeneous distributed in the sample. Meanwhile, the atomic ratio of S/Sn is close to 2, in good consistence with the stoichiometric ratio of SnS2. It can also be calculated that the weight ratio of SnS2 in the SGP is about 60%.
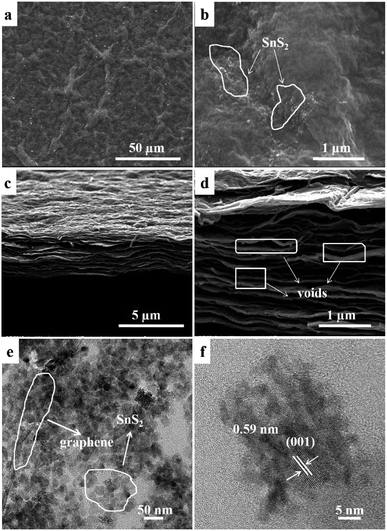 | ||
| Fig. 4 SEM images of SGP: (a and b) top- and (c and d) cross-section views; (e) TEM and (f) HRTEM images of SGP. | ||
The particle size of pristine SnS2 and SnS2 in the SGP are estimated from their TEM images (Fig. S4† and 4e) to be 6–10 nm and 20–25 nm respectively, in very good consistence with the XRD results. Furthermore, the TEM image of SGP (Fig. 4e) confirms that SnS2 nanoparticles are uniformly distributed on the graphene sheets, which can act as pillars and effectively prevent the graphene nanosheets from re-stacking. The HRTEM image demonstrates the crystalline nature of SnS2 nanoparticles, where the lattice spacing of 0.59 nm corresponds to the d-spacing of (001) diffraction planes of SnS2 (Fig. 4f). The XRD and TEM results confirm that hexagonal SnS2 nanocrystals have been preserved in the presence of thioacetamide aqueous solution, whereas the oxidization of SnS2 to SnO2 is inevitable under the usual hydrothermal condition without such a reducing agent.
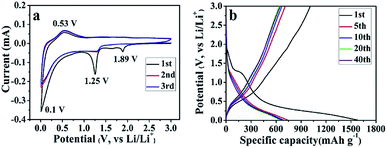
Unlike the conventional electrodes, the composite papers can be directly used to assemble LIBs without adding any conductive additive, binder and current collector, and comprehensive electrochemical measurements are carried out. First, the CV curves of the SGP half cell have been recorded in the potential range of 0.01–3.0 V (vs. Li/Li+) at a scan rate of 0.1 mV s−1. Fig. 5a presents the initial three cycles of the CV curves. During the 1st cycle, three apparent cathodic peaks have been observed at 1.89, 1.25 and 0.1 V (vs. Li/Li+). The cathodic peak at 1.89 V, which is absent in the subsequent cycles, can be ascribed to the intercalation of lithium ions into SnS2 layers without phase decomposition of SnS2 (eqn (1)).41,42
| SnS2 + xLi+ + xe− → LixSnS2 | (1) |
The reduction peak at 1.25 V is indexed to the decomposition of LixSnS2 into Sn and Li2S (eqn (2)), and the formation of irreversible solid electrolyte interface (SEI) film.42,43
| LixSnS2 + (4 − x)Li+ + (4 − x)e− → Sn + 2Li2S | (2) |
The reduction peak at 0.1 V represents the reversible alloying reaction between Li+ and metallic Sn (eqn (3)),42,43 as well as lithium ions insertion to graphene sheets.44
| Sn + xLi+ + xe− ↔ LixSn, where 0 ≤ x ≤ 4.4 | (3) |
On the other hand, only one prominent peak has been observed during the anodic scan at ∼0.53 V (vs. Li/Li+), which corresponds to the dealloying of LixSn (eqn (3)) and mainly contributes to the reversible capacity of SnS2-based nanocomposites.41 From the 2nd cycle onward, the cathodic and anodic peaks reproduce very well, indicating an excellent cyclic performance of the as-prepared SGP. The CV curves of the pristine SnS2 can be found in Fig. S5a,† which shows similar electrochemical reactions during the charge/discharge process with inferior cyclic stability.
The galvanostatic charge/discharge profiles of the SGP at a current density of 100 mA g−1 between 0.01–3.0 V (vs. Li/Li+) are displayed in Fig. 5b. The 1st discharge curve exhibits an apparent voltage plateau at ∼1.25 V (vs. Li/Li+), which represents the irreversible reduction of SnS2 to Sn (eqn (2)) and disappears in subsequent cycles. In comparison, such 1.25 V (vs. Li/Li+) voltage plateau, associated with the irreversible capacity is more pronounced for the pristine SnS2 (Fig. S5b†), which is consistent with the strong cathodic peak at ∼1 V (vs. Li/Li+) observed for SnS2 during 1st cathodic scan in CV measurements (Fig. S4a†). Furthermore, the initial discharge and charge capacities of the SGP electrode are 1576 and 1006 mA h g−1, remarkably higher than the pristine SnS2 (Fig. S5b†). In addition, there is no obvious capacity decay after 5 cycles, revealing excellent cyclic stability of the SGP. The initial coulombic efficiency of SGP is about 64%, higher than the 51% value of the pristine SnS2, and after 10 charge/discharge cycles, a stable coulombic efficiency of >98% is achieved.
As shown in Fig. 6a, a high reversible capacity of 593 mA h g−1 is delivered by the SGP electrode up to 200 cycles, exhibiting superior cycling stability to the pristine SnS2 nanocrystals, the latter suffers a significant capacity loss and remains only a specific capacity of 277 mA h g−1 after 200 cycles. Moreover, SGP electrode demonstrates an excellent rate capability, as shown in Fig. 6b. The current density is stepwise increased from 100 mA g−1 to 2 A g−1 to assess the rate performance. Even at a very high current density of 2 A g−1, the SGP electrode still can deliver a reversible capacity of 134 mA h g−1, whereas the pristine SnS2 itself has only 78 mA h g−1 left. Once the current density is restored to 100 mA g−1, the SGP electrode rapidly recovers to the initial specific capacity of 600 mA h g−1, more than doubles that of the pristine SnS2.
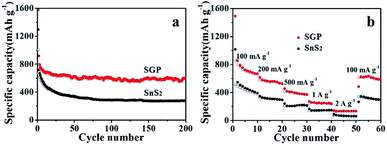 | ||
| Fig. 6 (a) Cyclic performance, at a current density of 100 mA g−1, and (b) rate capability, at different current densities, of the SGP and pristine SnS2 nanocrystals. | ||
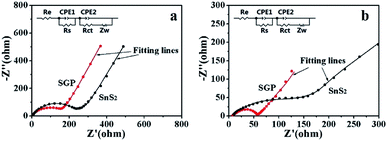
Fig. 7 presents the Nyquist plots of SGP and pristine SnS2 nanocrystals electrodes before and after 10 charge/discharge cycles. A depressed semi-circle in the high-frequency region along with an inclined spike in the low-frequency region have been observed in the measured spectra. The semi-circle is an overlapping result of the SEI impedance and charge-transfer impedance at the electrode/electrolyte interface, whereas the straight line is associated with the diffusion of Li+ through the bulk of electrode material, which can be described by Warburg impedance (Zw). An equivalent circuit is used to simulate the experimentally measured EIS spectra, as shown in the inset of Fig. 7, where Re represents the electrolyte resistance, Rs, Rct, CPE1 and CPE2 refer to the resistances and capacitances of SEI film and electrode/electrolyte interface, respectively.6,45 The fitting parameters are summarized in Table S1.† Obviously, the Rs and Rct of both electrodes decreased after cycling due to the better penetration of the electrolyte and the activation of the electrode material. Meanwhile, the total resistance (Re + Rs + Rct) of the SGP, before and after 10 charge/discharge cycling, is significantly smaller than the pristine SnS2, which indicates the enhanced conductivity and reduced polarization. The Li+ diffusion coefficient (DLi+) through the bulk of electrode material can be calculated from the straight line in the low frequency region by using eqn (4):46,47
| DLi+ = R2T2/2A2n4F4C2σ2 | (4) |
![[thin space (1/6-em)]](https://www.rsc.org/images/entities/char_2009.gif) 500 C mol−1), C is the lithium ion concentration (1 mol L−1, in the electrolyte), σ is the Warburg coefficient, which is related to Z′ (slope of the fitted Z′/ω−1/2 line). Fig. S6† shows the relationship between Z′ and ω−1/2 in the low frequency region for both the electrodes after 10 charge/discharge cycles. The calculated σ and DLi+ are listed in Table 1. It is obvious that the Li+ diffusion coefficient for the SGP (3.64 × 10⁻¹³ cm2 s−1) is three orders of magnitude higher than that of the pristine SnS2 nanocrystals electrode (1.00 × 10⁻¹⁶ cm2 s−1). Therefore, the higher Li+ diffusion coefficient endows the SGP electrode excellent cyclic performance and rate capability.
500 C mol−1), C is the lithium ion concentration (1 mol L−1, in the electrolyte), σ is the Warburg coefficient, which is related to Z′ (slope of the fitted Z′/ω−1/2 line). Fig. S6† shows the relationship between Z′ and ω−1/2 in the low frequency region for both the electrodes after 10 charge/discharge cycles. The calculated σ and DLi+ are listed in Table 1. It is obvious that the Li+ diffusion coefficient for the SGP (3.64 × 10⁻¹³ cm2 s−1) is three orders of magnitude higher than that of the pristine SnS2 nanocrystals electrode (1.00 × 10⁻¹⁶ cm2 s−1). Therefore, the higher Li+ diffusion coefficient endows the SGP electrode excellent cyclic performance and rate capability.
| Electrodes | σ (Ω cm2 s−1/2) | DLi+ (cm2 s−1) |
|---|---|---|
| SnS2 | 630.32 | 1.00 × 10⁻¹⁶ |
| SGP | 19.89 | 3.64 × 10⁻¹³ |
It is worth mentioning that the unique structure of SnS2-embedded graphene sheets renders synergistic effects on the improved electrochemical performance of the SGP electrode. On one hand, the excellent flexibility and electrical conductivity of graphene sheets endow it a suitable electrode host without adding conductive additive, binder and current collector, while being capable of avoiding the agglomeration of SnS2 nanocrystals and accommodating the volumetric changes of SnS2 during charge/discharge process. On the other hand, the SnS2 nanocrystals, embedded between the graphene sheets, effectively suppress the re-stacking of graphene sheets and induce voids and pores, as evidenced by SEM (Fig. 4d), which favor the electrolyte penetration thus introducing more active sites for lithium storage.
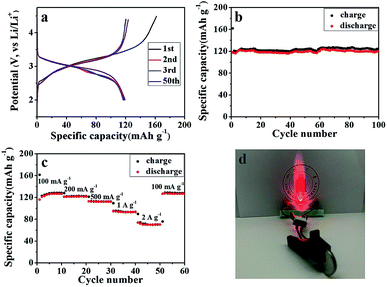
A full cell was also assembled by pairing the SGP with a commercial LiFePO4 as the cathode material. The morphology, crystal structure, and cycling performance of the LiFePO4 are shown in Fig. S7.† The commercial LiFePO4 electrode exhibits an initial coulombic efficiency of 74.24% and can maintain a reversible specific capacity of 134 mA h g−1 (Fig. S7c and d†). Fig. 8a shows the galvanostatic charge/discharge profiles of the LiFePO4/SGP full cell at a current density of 100 mA g−1 between 2.0–4.5 V (vs. Li/Li+). The initial charge and discharge specific capacities (based on the mass of cathode LiFePO4) are 162 and 118 mA h g−1, respectively, with a calculated coulombic efficiency of 72.84%, which is similar to that of the LiFePO4 cathode. In addition, the full cell presents less flat charging/discharging plateaus than the LiFePO4 half cell, and after the initial cycle, a stable coulombic efficiency of >96% is achieved. The cycling performance of the full cell is shown in Fig. 8b and c, demonstrating a stable reversible capacity of 124 mA h g−1 at a current density of 100 mA g−1, as well as an outstanding rate performance with increasing current rates. Even at high current densities of 1 A g−1 and 2 A g−1, the full cell still delivers reasonable capacities of 93 and 70 mA h g−1 respectively, and displays rapid recovery to the initial 126 mA h g−1 as soon as the current density is restored to 100 mA g−1. Fig. 8d is a digital photograph of a LED light lit by the working LiFePO4/SGP full cell. These results confirm the practical applications of the as-prepared SGP as an anode for high performance LIBs.
4. Conclusions
In summary, flexible and free-standing SnS2/rGO nanocomposite papers were prepared by using a novel hydrothermal process at the solid/gas interface for the first time. A thioacetamide aqueous solution is employed as not only a reducing agent, but also a stabilizer preventing SnS2 from transformation into SnO2 when subject to hydrothermal reaction. This new two-phase hydrothermal strategy realizes the reduction of GO, and more importantly, successfully preserves the mechanical integrity as well as the flexibility of the graphene papers, and stabilizes the crystal phase of the active material SnS2. Owing to the high conductivity and flexibility of graphene sheets and unique sandwiched structure of the as-prepared SnS2/graphene nanocomposite, a reversible capacity of 593 mA h g−1 has been achieved for the SGP electrode after 200 charge/discharge cycles at a current density of 100 mA g−1. In addition, a full lithium ion battery of LiFePO4/SGP is successfully assembled with reasonably high reversible capacities. Both the SGP electrode and the LiFePO4/SGP full cell demonstrate excellent cyclic stability and high rate capability. This method offers great opportunities to more LIB active materials for fabrication of flexible graphene-based paper electrodes otherwise difficult to be made under conventional hydrothermal or thermal conditions.Conflicts of interest
There are no conflicts to declare.Acknowledgements
This work was financially supported by the National Key R&D Program of China (no. 2017YFE0111500), the National Natural Science Foundation of China (no. 51673123 and 51222305), and Sichuan Province Science and Technology Project (no. 2016JQ0049).References
- J. M. Tarascon and M. Armand, Nature, 2001, 414, 359–367 CrossRef CAS PubMed.
- J. Jiang, Y. Y. Liu, J. P. Liu, X. T. Huang, C. Z. Yuan and X. W. Lou, Adv. Mater., 2012, 24, 5166–5180 CrossRef CAS.
- J. Chen and F. Y. Cheng, Acc. Chem. Res., 2009, 42, 713–723 CrossRef CAS.
- H. W. Zhang, X. D. Huang, O. Noonan, L. Zhou and C. Z. Yu, Adv. Funct. Mater., 2017, 27, 1606023 CrossRef.
- R. Z. Hu, Y. P. Ouyang, T. Liang, H. Wang, J. Liu, J. Chen, C. H. Yang, L. C. Yang and M. Zhu, Adv. Mater., 2017, 29, 1605006 CrossRef PubMed.
- L. Deng, J. F. Zhu, X. J. Chen, M. Ding and H. Liu, J. Alloys Compd., 2018, 739, 1015–1024 CrossRef CAS.
- W. B. Zhu, Y. W. Yang, D. M. Ma, H. Wang, Y. Zhang and H. Y. Hu, Ionics, 2015, 21, 19–26 CrossRef CAS.
- X. J. Lu, D. X. Liu, T. L. Han, M. Y. Zhu, S. O. Ryu and J. R. Huang, J. Alloys Compd., 2018, 765, 1061–1071 CrossRef CAS.
- Z. X. Wei, L. Wang, M. Zhuo, W. Ni, H. X. Wang and J. M. Ma, J. Mater. Chem. A, 2018, 6, 12185–12214 RSC.
- D. D. Gao, Y. R. Wang, Y. Liu, H. P. Sun, M. H. Wu and H. J. Zhang, J. Colloid Interface Sci., 2019, 538, 116–124 CrossRef CAS PubMed.
- Y. P. Du, Z. Y. Yin, X. H. Rui, Z. Y. Zeng, X. J. Wu, J. Q. Liu, Y. Y. Zhu, J. X. Zhu, X. Huang, Q. Y. Yan and H. Zhang, Nanoscale, 2013, 5, 1456–1459 RSC.
- A. Q. Zhu, L. L. Qiao, P. F. Tan, Y. J. Ma, Y. Liu and J. Pan, J. Solid State Chem., 2018, 261, 16–21 CrossRef CAS.
- Y. Y. Wang, J. H. Zhou, J. H. Wu, F. J. Chen, P. R. Li, N. Han, W. J. Huang, Y. P. Liu, H. L. Ye, F. P. Zhao and Y. G. Li, J. Mater. Chem. A, 2017, 5, 25618–25624 RSC.
- X. X. Zhang, Y. F. Zhan, F. Y. Xie, W. H. Zhang, J. Chen, W. G. Xie, W. J. Mai and H. Meng, Electrochemistry, 2016, 84, 420–426 CrossRef CAS.
- D. S. Guan, J. Y. Li, X. F. Gao, Y. Y. Xie and C. Yuan, J. Alloys Compd., 2016, 658, 190–197 CrossRef CAS.
- J. T. Zai, K. X. Wang, Y. Z. Su, X. F. Qian and J. S. Chen, J. Power Sources, 2011, 196, 3650–3654 CrossRef CAS.
- C. X. Zhai, N. Du, H. Zhang, J. X. Yu and D. R. Yang, ACS Appl. Mater. Interfaces, 2011, 3, 4067–4074 CrossRef CAS PubMed.
- W. N. Deng, X. H. Chen, Z. Liu, A. P. Hu, Q. L. Tang, Z. Li and Y. N. Xiong, J. Power Sources, 2015, 277, 131–138 CrossRef CAS.
- Z. M. Ma, Y. S. Wang, Y. B. Yang, M. Yousaf, M. C. Zou, A. Y. Cao and R. P. Han, RSC Adv., 2016, 6, 30098–30105 RSC.
- Y. F. Zhang, C. Y. Zhao, Z. H. Zeng, J. M. Ang, B. Y. Che, Z. Wang and X. H. Lu, Electrochim. Acta, 2018, 278, 156–164 CrossRef CAS.
- S. Tao, D. J. Wu, S. M. Chen, B. Qian, W. S. Chu and L. Song, Chem. Commun., 2018, 54, 8379–8382 RSC.
- P. L. Zheng, Z. F. Dai, Y. Zhang, K. N. Dinh, Y. Zheng, H. Fan, J. Yang, R. Dangol, B. Li, Y. Zong, Q. Y. Yan and X. B. Liu, Nanoscale, 2017, 9, 14820–14825 RSC.
- Y. Jiang, Y. Z. Feng, B. J. Xi, S. S. Kai, K. Mi, J. K. Feng, J. H. Zhang and S. L. Xiong, J. Mater. Chem. A, 2016, 4, 10719–10726 RSC.
- H. Q. Jin, M. Z. Gu, S. M. Ji, X. J. Xu and J. Liu, Ionics, 2016, 22, 1811–1818 CrossRef CAS.
- B. H. Qu, G. Ji, B. Ding, M. H. Lu, W. X. Chen and J. Y. Lee, ChemElectroChem, 2015, 2, 1138–1143 CrossRef CAS.
- J. F. Liang, Y. Zhao, L. Guo and L. D. Li, ACS Appl. Mater. Interfaces, 2012, 4, 5742–5748 CrossRef CAS PubMed.
- T. Gao, K. Huang, X. Qi, H. X. Li, L. W. Yang and J. X. Zhong, Ceram. Int., 2014, 40, 6891–6897 CrossRef CAS.
- J. K. Lee, K. B. Smith, C. M. Hayner and H. H. Kung, Chem. Commun., 2010, 46, 2025–2027 RSC.
- X. Zhao, C. M. Hayner, M. C. Kung and H. H. Kung, Adv. Energy Mater., 2011, 1, 1079–1084 CrossRef CAS.
- J. Chen, H. Bi, S. R. Sun, Y. F. Tang, W. Zhao, T. Q. Lin, D. Y. Wan, F. Q. Huang, X. D. Zhou, X. M. Xie and M. H. Jiang, ACS Appl. Mater. Interfaces, 2013, 5, 1408–1413 CrossRef CAS PubMed.
- X. Wang, X. Q. Cao, L. Bourgeois, H. Guan, S. M. Chen, Y. Zhong, D. M. Tang, H. Q. Li, T. Y. Zhai, L. Li, Y. Bando and D. Golberg, Adv. Funct. Mater., 2012, 22, 2682–2690 CrossRef CAS.
- Y. Dai, S. D. Cai, W. J. Yang, L. Gao, W. P. Tang, J. Y. Xie, J. Zhi and X. M. Ju, Carbon, 2012, 50, 4648–4654 CrossRef CAS.
- X. L. Yang, K. C. Fan, Y. H. Zhu, J. H. Shen, X. Jiang, P. Zhao, S. R. Luan and C. Z. Li, ACS Appl. Mater. Interfaces, 2013, 5, 997–1002 CrossRef CAS PubMed.
- M. Sathish, S. Mitani, T. Tomai, A. Unemoto and I. Honma, J. Solid State Electrochem., 2012, 16, 1767–1774 CrossRef CAS.
- M. Sathish, S. Mitani, T. Tomai and I. Honma, J. Phys. Chem. C, 2012, 116, 12475–12481 CrossRef CAS.
- L. Yao, Y. C. Zhang, J. Li and Y. Chen, Sep. Purif. Technol., 2014, 122, 1–5 CrossRef CAS.
- K. Xu, N. Li, D. W. Zeng, S. Q. Tian, S. S. Zhang, D. Hu and C. S. Xie, ACS Appl. Mater. Interfaces, 2015, 7, 11359–11368 CrossRef CAS PubMed.
- H. Wen, B. B. Guo, W. B. Kang and C. H. Zhang, RSC Adv., 2018, 8, 14032–14039 RSC.
- Y. C. Zhang, J. Li, M. Zhang and D. D. Dionysiou, Environ. Sci. Technol., 2011, 45, 9324–9331 CrossRef CAS PubMed.
- S. Chen, J. J. Duan, J. R. Ran, M. Jaroniec and S. Z. Qiao, Energy Environ. Sci., 2013, 6, 3693–3699 RSC.
- B. Luo, Y. Fang, B. Wang, J. S. Zhou, H. H. Song and L. J. Zhi, Energy Environ. Sci., 2012, 5, 5226–5230 RSC.
- J. Xia, L. Liu, J. J. Xie, H. X. Yan, Y. T. Yuan, M. F. Chen, C. Huang, Y. Zhang, S. Nie and X. Y. Wang, Electrochim. Acta, 2018, 269, 452–461 CrossRef CAS.
- L. Mei, C. Xu, T. Yang, J. M. Ma, L. B. Chen, Q. H. Li and T. H Wang, J. Mater. Chem. A, 2013, 1, 8658–8664 RSC.
- D. D. Cai, S. Q. Wang, L. X. Ding, P. C. Lian, S. Q. Zhang, F. Peng and H. H. Wang, J. Power Sources, 2014, 254, 198–203 CrossRef CAS.
- X. X. Zuo, B. Li, K. Chang, H. W. Tang and Z. R. Chang, RSC Adv., 2017, 7, 53126–53134 RSC.
- S. B. Tang, M. O. Lai and L. Lu, Mater. Chem. Phys., 2008, 1, 149–153 CrossRef.
- K. Tang, X. Q. Yu, J. P. Sun, H. Li and X. J. Huang, Electrochim. Acta, 2011, 13, 4869–4875 CrossRef.
Footnote |
| † Electronic supplementary information (ESI) available. See DOI: 10.1039/c9ra03397a |
| This journal is © The Royal Society of Chemistry 2019 |

