 Open Access Article
Fabrication of a novel BiOI/KTaO3 p–n heterostructure with enhanced photocatalytic performance under visible-light irradiation
Xiaoxiao Luab,
Qiang Li *ab,
Shihao Liuab,
Rui Luoab,
Hong Liab,
Min Zhangab,
Chaopeng Cuiab,
Guangping Zhuab,
San Chenab and
Changhao Liang*c
aCollege of Physics and Electronic Information, Huaibei Normal University, Huaibei, 235000, P. R. China. E-mail: qiangli@chnu.edu.cn
bAnhui Province Key Laboratory of Pollutant Sensitive Materials and Environmental Remediation, Huaibei Normal University, Huaibei, 235000, P. R. China
cKey Laboratory of Materials Physics, Anhui Key Laboratory of Nanomaterials and Nanotechnology, Institute of Solid State Physics, Hefei Institutes of Physical Science, Chinese Academy of Sciences, Hefei, 230031, P. R. China. E-mail: chliang@issp.ac.cn
First published on 17th March 2020
Abstract
In this study, a series of BiOI/KTaO3 p–n heterojunctions were prepared via a facile in situ chemical bath strategy. The photocatalytic properties of the catalysts was tested by the degradation of Rhodamine B (RhB) and phenol under visible light irradiation. The BiOI/KTaO3 composites exhibited improved photocatalytic efficiency compared to the individual catalysts. In particular, 54 wt% BiOI/KTaO3 displayed the highest photocatalytic activity since it degraded 98.6% RhB within 30 minutes, while only 68.1% RhB was degraded over pure BiOI under identical conditions. In addition, the reaction kinetic constant of RhB degradation over 54 wt% BiOI/KTaO3 was approximately 2.56 and 115-fold larger than those of pure BiOI and KTaO3, respectively. The results of PL, photocurrent and EIS indicated that the improved photocatalytic efficiency could root in the p–n junction formed between BiOI and KTaO3, which was conducive to the separation and migration of photo-generated carriers. Furthermore, a free-radical capture experiment illustrated that h+ and ˙O2− were the key factors in the photodegradation of RhB.
1. Introduction
Recently, semiconductor photocatalysis as an ideal green technology has been extensively employed to deal with the energy shortage and environmental pollutions because of its direct utilization of solar energy and environmental friendliness.1–4 Although the TiO2 semiconductor has attracted worldwide attention owing to its low price, nontoxicity and good stability against photocorrosion,5–7 it can only capture ultraviolet (UV) light due to its relatively large bandgap (∼3.2 eV).8,9 UV light only comprises ∼4% of the solar spectrum, while the visible light makes up the greater part of sunlight.10 Thus, more and more visible-light-driven photocatalysts have been designed and synthesized to maximize the sunlight utilization efficiency, such as α-Fe2O3,11 Bi2MoO6,12 Ag3PO4 (ref. 13) and SnS2.14,15Among the newly developed photocatalysts, Bi-based oxides such as BiOBr, BiOI and BiOCl have been extensively investigated due to their high stability, low price and outstanding photocatalytic activity.16–19 Among the BiOX photocatalysts, BiOI, a p-type semiconductor, has the smallest band gap (1.6–1.9 eV) and strongest visible-light response capacity.20–22 Therefore, BiOI has been widely utilized in the photocatalytic removal of antibiotics and refractory pollutants22–25 and the photoreduction of CO2.26 Up to now, researchers have successfully fabricated many BiOI microstructures with various morphologies, such as nanosheets,18 nanoflowers25,27 and microspheres.20,28 Although extensive efforts have been made towards the fabrication of BiOI configurations, the photocatalytic properties of individual BiOI was still not satisfactory because of the short lifetime of photoexcited charge carriers.21 Hence, many strategies have been developed to make BiOI applicable in practical use.26,29 One of the most effective alternatives was to combine BiOI with another semiconductor to form heterojunctions. In particular, building p–n heterostructures can effectively promote the transfer of the photoexcited carriers owing to the inducement of inner electric field and closely contacted interfaces.30,31 For example, Wen et al. successfully prepared p–n heterostructure BiOI/SnO2 and found that the hybrids displayed an outstanding photocatalytic activity towards the degradation of refractory pollutants.18 Lately, Xia et al. reported a novel n–p heterostructure SrTiO3/BiOI composite and its excellent photocatalytic properties for crystal violet decomposition under simulated solar light irradiation.29 Thus, constructing a p–n heterojunction by coupling BiOI to an n-type semiconductor with appropriate energy band configuration was a promising method to obtain efficient visible-light-activated photocatalysts.
Moreover, as an important class of photocatalysts, perovskite-structured tantalates have been widely employed in both the mineralization of organic pollutants and water splitting due to their photoactivity, chemical stability, and nontoxicity.32–34 Among the tantalate photocatalysts, potassium tantalate (KTaO3), a typical n-type semiconductor, was shown to be a promising photocatalytic material.35 However, the wide band gap (∼3.6 eV) and unsatisfying quantum efficiency hampered its practical applications.36 Therefore, numerous strategies, such as doping of foreign elements,37 construction of solid solutions,38 and building heterojunctions,39,40 have been developed to strengthen the photocatalytic activity. For example, Yong et al. synthesized g-C3N4/KTaO3 composite and found that it displayed a largely enhanced photocatalytic property for RhB degradation under visible-light irradiation.36 However, KTaO3-based heterostructures with an outstanding photocatalytic activity and high stability are still rare. Building p–n heterojunction BiOI/KTaO3 hybrid materials would be an efficient way to form an ideal composite photocatalyst with high visible-light activity. Unfortunately, as far as we know, the research focused on the BiOI/KTaO3 photocatalyst has not been reported.
In this study, for the first time, we fabricated p–n heterojunction BiOI/KTaO3 composites through a facile strategy. The photocatalytic efficiency of the BiOI/KTaO3 heterostructure was examined by RhB degradation with visible-light irradiation (λ > 400 nm). The outcomes showed that the BiOI/KTaO3 composites were high-efficiency visible-light-activated photocatalysts to remove organic pollutants. The BiOI/KTaO3 heterojunctions showed a much superior photocatalytic activity towards RhB removal compared to BiOI and KTaO3 alone. Furthermore, the possible photocatalytic mechanism behind the improved photocatalytic efficiency has been proposed and discussed in detail.
2. Experimental
2.1 Preparation of KTaO3
The KTaO3 nanocubes were fabricated via a hydrothermal process. In brief, 1.105 g Ta2O5 was dissolved in a 25 ml KOH aqueous solution (15 mol l−1) under constant magnetic stirring for 1 hour. Subsequently, the mixed solution was reacted at 150 °C for 5 hours. Ultimately, the product was cleaned with deionized water and anhydrous ethanol, and then dried at 60 °C for 12 hours to get the KTaO3 sample.2.2 Synthesis of BiOI/KTaO3
The BiOI/KTaO3 heterostructures were fabricated through a facile in situ chemical bath method. First, 300 mg of KTaO3 was dispersed into 40 ml of distilled water under ultrasonication for 0.5 hour and then stirred magnetically for 10 min to get a well-dispersed suspension, marked as A. Second, 20 ml of ethylene glycol containing 1 mmol Bi(NO3)3·5H2O was drop-wise added to A; the mixed solution was marked as B. Third, 10 ml of deionized water containing 1 mmol of KI was added to B with stirring violently for 0.5 hours; it was marked as C. Subsequently, C was reacted in a water bath at 80 °C for 2 hours. Finally, the sediment was cleaned with deionized water and anhydrous ethanol, and then dried at 60 °C overnight to obtain 54 wt% BiOI/KTaO3 samples. Other BiOI/KTaO3 composites with different contents of BiOI (37 wt% and 70 wt%) were fabricated by varying the amounts of Bi(NO3)3·5H2O and KI. Pure BiOI was synthesized via a similar way without the addition of KTaO3.2.3 Characterization
The phases of all the samples were characterized using an X-ray diffractometer (XRD, D8 ADVANCE, Bruker, Germany) with Cu Kα radiation. The field-emission scanning electron microscopy (FESEM, SU8220, Hitachi, Japan) and transmission electron (TEM) and high-resolution TEM (HRTEM) (JEM-2100) were used to observe the microstructure and element mapping of the samples. A UV visible absorption spectrum (DRS) was recorded using a PerkinElmer Lambda 950 spectrometer using BaSO4 powder as reference. The element state of BiOI/KTaO3 was characterized via X-ray photoelectron spectroscopy (XPS) using an ESCALAB250Xi spectrometer. Photoluminescence (PL) spectra were recorded on a PLS920 fluorescence spectrometer at room temperature.2.4 Photocatalytic experiment
The photocatalytic property of the as-prepared samples was measured through detecting the degradation of RhB (10 mg l−1) and phenol (5 mg l−1) under visible-light irradiation. A 500 W Xe lamp equipped with a 400 nm filter was used as the light source (180 mW cm−2). In detail, 0.05 g of samples was put into a 100 ml RhB or phenol solution. Then, the suspension was stirred in dark intensely for 1 hour to get absorption–desorption equilibrium. After that, the stirred suspensions were exposed to the irradiation, 4 ml liquid was taken out and centrifuged at a certain timespan. Then, a spectrophotometer (UV-6000PC) was used to detect the concentration changes of RhB or phenol. The characteristic peaks were at 553 nm and 270 nm for RhB and phenol, respectively.2.5 Photoelectrochemical test
Electrochemical detection was carried out on a photoelectrochemical workstation (CHI 760E, Shanghai Chenhua, China) that was equipped with a standard three-electrode. Electrolyte was prepared with 0.2 M Na2SO4, and the working electrode was manufactured by the following steps: first, 0.03 g sample was added into 100 μl of ethyl alcohol with 20 μl of Nafion; second, the photocatalyst was ground to form a pulp; third, the slurry photocatalyst was deposited on a fluoride-tin oxide (FTO) glass. The Ag/AgCl electrode was used as the reference electrode, while a Pt wire as the counter electrode.3. Results and discussion
3.1 Characterization
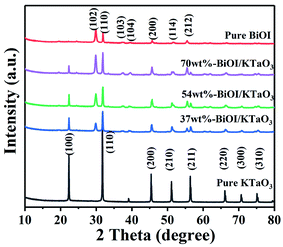
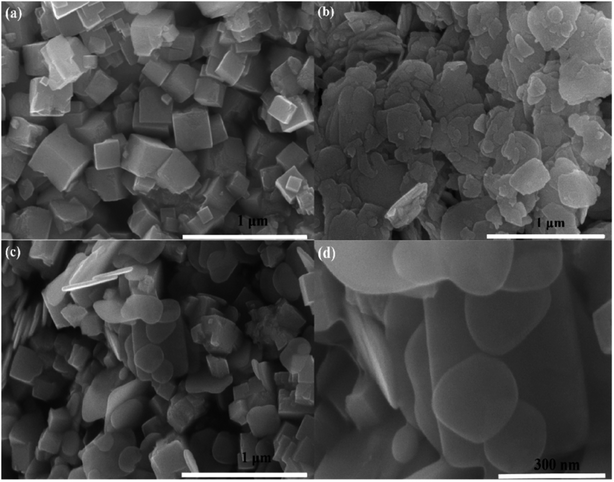
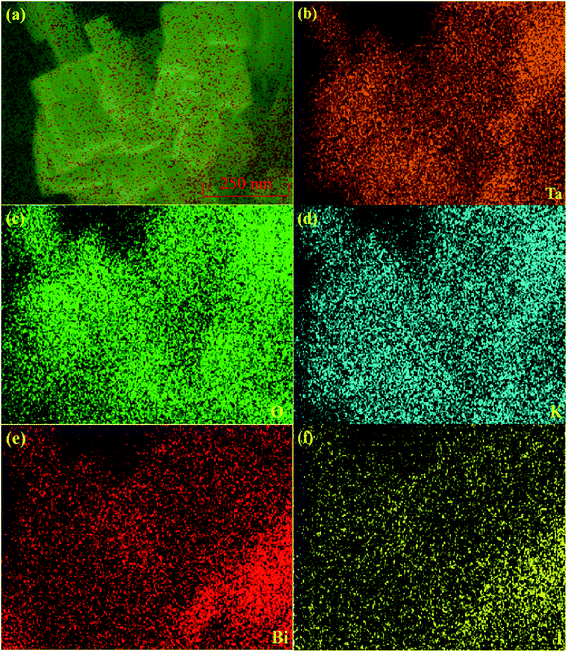
The phase structure of those as-formed catalysts was investigated via XRD. Fig. 1 illustrates that all of the diffraction peaks for BiOI can be well assigned to the pure tetragonal BiOI phase (JCPDS no: 10-0445) and those of KTaO3 perfectly assigned to the cubic phase of KTaO3 (JCPDS no: 38-1470). In addition, the peaks in the BiOI/KTaO3 composites include both the diffraction peaks of BiOI and KTaO3, revealing that the two phases existed in BiOI/KTaO3 heterostructures. There was no other impurity peaks in the composites, thus indicating the high purity of the BiOI/KTaO3 composites.FESSEM was used for determining the microstructure of pure KTaO3, BiOI and BiOI/KTaO3 heterostructures. As shown in Fig. 2a, pure KTaO3 presented irregular nanocubes with smooth surfaces, and the size of those cubes was about 300 nm. Moreover, pure BiOI (Fig. 2b) showed the structure of nanosheets. With respect to the BiOI/KTaO3 composites (Fig. 2c), a large amount of BiOI nanosheets attached tightly to the surface of KTaO3 nanocubes, and Fig. 2d presents the enlarged SEM image of the BiOI/KTaO3 composite. It is worth noting that the size of the BiOI nanosheets became smaller after being contacted with KTiO3. The reason may be attributed to the fact that the growth of BiOI could be restricted by KTaO3 nanocube. To further demonstrate the heterojunction established between KTaO3 and BiOI, elemental mapping was introduced. The distribution of elements of 54 wt% BiOI/KTaO3 is shown in Fig. 3(a)–(f); the I, K, Ta, Bi and O maps were detected, which illustrated that the composite consisted of BiOI and KTaO3.
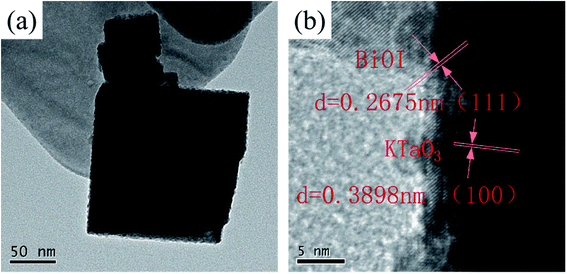
The detailed interface contact of BiOI/KTaO3 was detected by TEM and HRTEM. Fig. 4a displays that the BiOI nanosheets are fixed on the surface of the KTaO3 nanocubes. Fig. 4b shows the HRTEM image of BiOI/KTaO3, and there are two sets of lattice fringes in different directions. The interplanar crystal spacing of 0.2675 nm was indexed to the (111) crystallographic plane of BiOI, while 0.3898 nm belonged to plane (100) of KTaO3, which was consistent with the previous studies.41,42
To analyze the elemental valence state of the composites, XPS measurement was carried out. As shown in Fig. 5a, Bi, O, I, K and O coexisted in the BiOI/KTaO3 composite. The peak of C 1s at 284.8 eV is due to the adventitious hydrocarbon produced by the XPS instrument.43 Fig. 5b showed double peaks at the binding energies of 619.1 and 630.6 eV, which are indexed to I 3d5/2 and I 3d3/2,44–46 respectively. Two peaks for K 2p at 292.2 and 294.9 eV (Fig. 5c) belonged to K 2p3/2 and K 2p1/2, respectively. Two distinct peaks at 26.2 and 28.4 eV are assigned to Ta 4f7/2 and Ta 4f5/2, respectively; it was obvious that Ta existed as Ta5+ in KTaO3 (ref. 47) (Fig. 5d). Fig. 5e shows the peaks of Bi 4f5/2 and Bi 4f7/2 at 164.5 and 159.2 eV,44,45,48 respectively. The peak for O 1s at 530.2 eV came from BiOI or KTaO3 as O2−, while the other peak at 531.6 eV (Fig. 5f) belonged to the hydroxyl groups.44,48 The XPS results indicated the coexistence of BiOI and KTaO3.
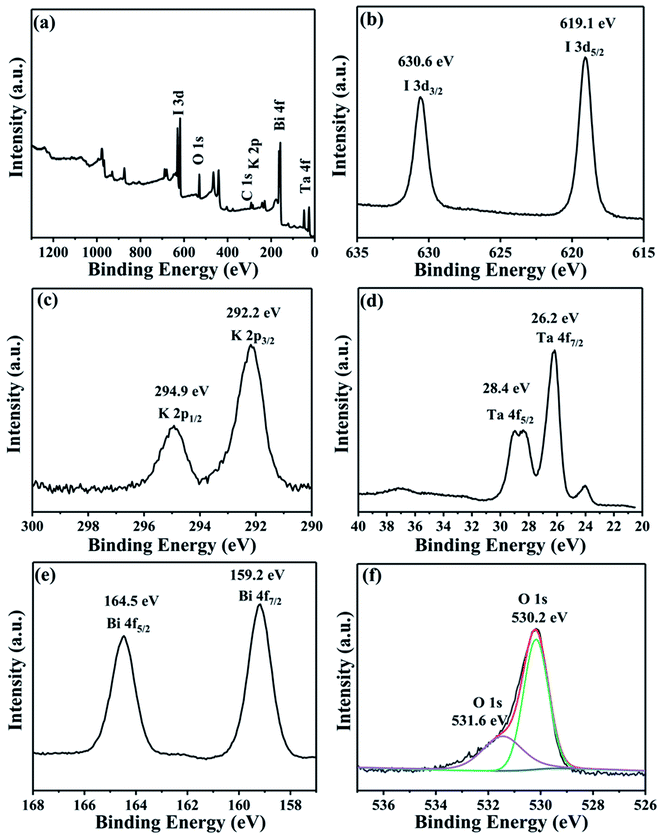 | ||
| Fig. 5 XPS patterns of 54 wt% BiOI/KTaO3 composite: (a) survey; (b) I 3d; (c) K 2p; (d) Ta 4f; (e) Bi 4f; and (e) O 1s. | ||
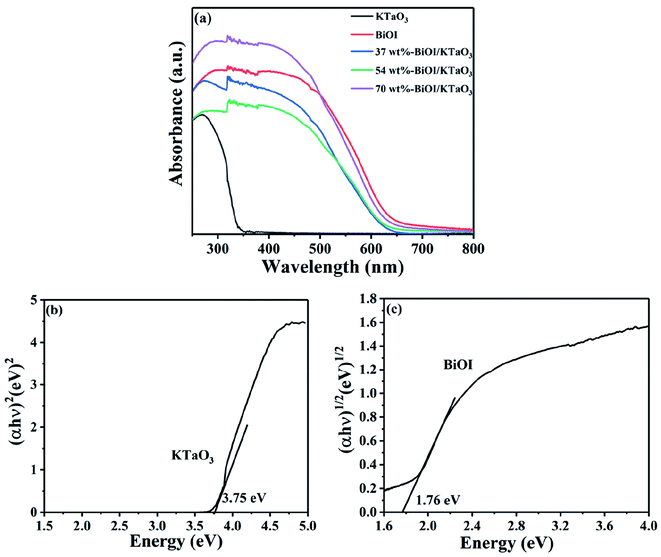
The optical absorption property of the BiOI, KTaO3 and BiOI/KTaO3 composites was characterized via DRS. Optical absorption coefficient satisfied the following formula:
| αhν = A(hν − Eg)n/2 |
3.2 Photocatalytic activity
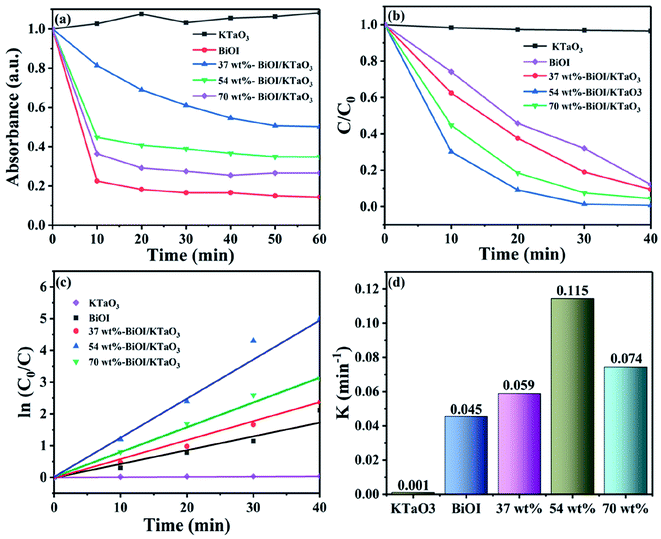
The photocatalytic efficiency of the BiOI/KTaO3 hybrid materials was examined by decomposing RhB in the presence of visible light. The adsorption property of the sample has a significant effect on the degradation process; thus, the adsorption performance of as-obtained catalysts for RhB degradation was first studied and displayed in Fig. 7(a). Clearly, the adsorption efficiencies of the hybrid materials increased along with the increase in the BiOI content, which could be ascribed to the relatively high surface area of BiOI. In addition, the adsorption–desorption equilibrium was achieved in an hour; hence, the adsorption made almost no difference on the following photocatalytic experiments. The RhB photodegradation with the various samples is displayed in Fig. 7(b). Obviously, pure KTaO3 has a poor photocatalytic capacity and only about 3% of the dye was degraded, while about 68.1% of RhB was degraded by BiOI within 30 min. Compared to pure catalysts, the BiOI/KTaO3 composites showed superior photocatalytic efficiency, which can be ascribed to the effective interfacial charge transfer due to the formation of heterojunctions. Furthermore, it is suggested that the amount of BiOI in composites played a significant part in the photodegradation process. The degradation efficiency of RhB over BiOI/KTaO3 heterojunctions increased first, and then decreased along with the increase in the BiOI content. When the mass percentage of BiOI in the composite was 54 wt%, BiOI/KTaO3 heterojunctions exhibited the optimal photocatalytic activity as it degraded ∼98.6% of RhB in 30 min, which was 1.45-fold larger than that of single BiOI.For the purpose of investigating the degradation kinetics of RhB, the pseudo-first-order model was introduced. Fig. 7(c) shows the fitted curve of the measured data. The result satisfied the pseudo-first-order model. The kinetic constant was determined by the following equation: ln(C0/Ct) = kt.52 Herein, C0 and Ct denote the concentrations of RhB when time is 0 and t min, respectively, and k is the constant of kinetics. Fig. 7(c) displays that the slope of the BiOI/KTaO3 composite is much higher than that of pure samples. Moreover, the k values of all the samples are calculated and shown in Fig. 7(d). The k value of 54 wt% BiOI/KTaO3 was nearly 0.115 min−1, while that of BiOI, 37 wt% BiOI/KTaO3, 70 wt% BiOI/KTaO3 and KTaO3 was about 0.045 min−1, 0.059 min−1, 0.074 min−1 and 0.001 min−1, respectively. In addition, the k value of 54 wt% BiOI/KTaO3 was about 2.56 and 115 times as much as BiOI and KTaO3.
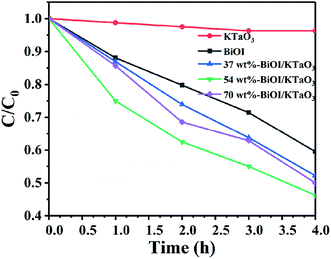
The photocatalytic degradation of the non-dye compound was also studied with that of the as-fabricated samples. Fig. 8 displays the photodegradation of phenol under the irradiation of visible light. Clearly, the degradation efficiency of phenol by all catalysts followed the order: 54 wt% BiOI/KTaO3 > 70 wt% BiOI/KTaO3 > 37 wt% BiOI/KTaO3 > BiOI > KTaO3. The result was consistent with the outcomes of RhB decomposition under visible-light irradiation. The 54 wt% BiOI/KTaO3 composites also exhibited the highest photocatalytic capacity for the removal of phenol among the as-obtained catalysts.
The stability of the catalyst is an important factor in practical applications. Herein, a cycle experiment was carried out using the 54 wt% BiOI/KTaO3 composite. Fig. 9(a) displays that the photodegradation efficiency of dyes still reached 91.1% after three cycling runs. Besides, the photocatalyst was collected after the cycle experiment, and the phase structure of the catalyst before and after the cycle experiment is presented in Fig. 9(b). No other changes could be found from the XRD result, indicating that the structure of the composite was stable.
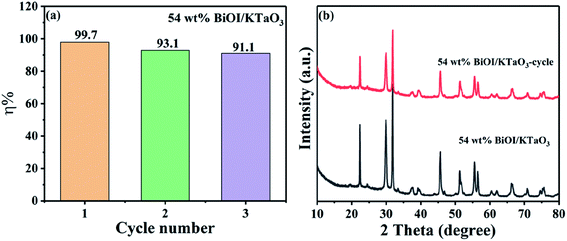 | ||
| Fig. 9 (a) Cycle experiment of degradation rate of RhB by 54 wt% BiOI/KTaO3 sample, (b) XRD pattern of 54 wt% BiOI/KTaO3 composite before and after cycle experiment. | ||
3.3 Mechanism of the improved photocatalytic efficiency
To explore the main active species in the photodegradation process, free-radical capture experiments were performed. Benzoquinone (BQ) was used as the scavenger for ˙O2−,53 while triethanolamine (TEOA) and isopropanol (IPA) were used as the scavengers for h+ (ref. 54) and ˙OH,55 respectively. Fig. 10 shows the removal efficiency of RhB by 54 wt% BiOI/KTaO3 with and without the addition of various scavengers. Obviously, the degradation efficiency of dyes had no apparent change after the introduction of IPA, implying that ˙OH played a negligible part in the photocatalytic process. However, with the introduction of TEOA or BQ into the photocatalytic system, the RhB degradation efficiency greatly decreased, and only 20.0% or 50.2% RhB was removed after 40 min of irradiation. These results revealed that ˙O2− and h+ were the primary reactive species in the photodegradation of RhB.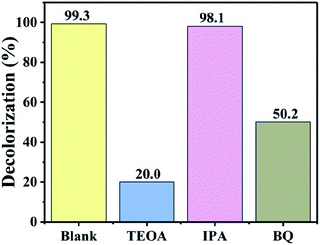 | ||
| Fig. 10 Effect of scavengers on the photodegradation of RhB by 54 wt% BiOI/KTaO3 under visible light irradiation. | ||
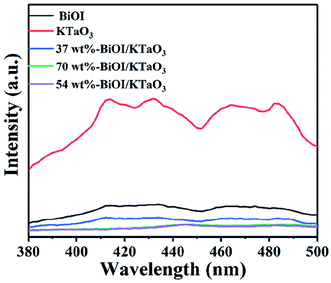
The photoluminescence (PL) spectroscopy is widely employed to study the separation efficiency of photo-induced carriers. In general, the lower PL intensity indicates the higher separation efficiency of photo-generated electron–hole pairs,56 corresponding to the higher photocatalytic efficiency. The PL spectra of all the catalysts are shown in Fig. 11. Clearly, the pure samples showed higher PL intensity compared to the BiOI/KTaO3 composites, indicating that the separation efficiency of carriers in the BiOI/KTaO3 composites was higher than those of BiOI and KTaO3. The result can be ascribed to the inner electric field established between KTaO3 and BiOI, which was conducive to the separation of photo-induced carriers.
In order to further investigate the separation and transfer of photo-induced electrons and holes, the photoelectrochemical measurements were carried out. Fig. 12a shows the photocurrent–time curves of the BiOI, KTaO3 and BiOI/KTaO3 composites under visible light irradiation. The photocurrent intensity showed the following orders: 54 wt% BiOI/KTaO3 > 70 wt% BiOI/KTaO3 > 37 wt% BiOI/KTaO3 > BiOI > KTaO3, which was in agreement with the degradation profiles. In general, the higher photocurrent implies the more effective separation of the photo-induced carriers. Therefore, the construction of the BiOI/KTaO3 heterostructures was helpful for the separation and migration of charge carriers. Furthermore, EIS measurement can also be used to demonstrate the abovementioned results. From Fig. 12b, the resistance of pure BiOI and 54 wt% BiOI/KTaO3 was measured with and without visible-light irradiation, respectively. It can be seen that the radius of 54 wt% BiOI/KTaO3 composite was smaller than that of pure BiOI with or without irradiation, indicating that the transfer efficiency of the electrons in the 54 wt% BiOI/KTaO3 composite was higher than that of BiOI. The results further confirmed that the p–n junction was helpful for the separation and migration of photo-induced carriers.
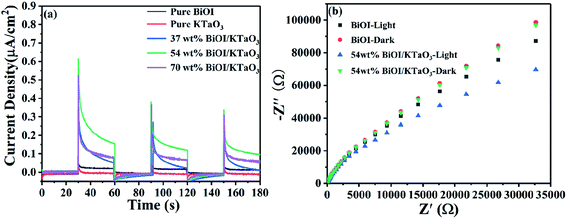 | ||
| Fig. 12 (a) Photocurrent responses of all samples under visible light irradiation, (b) EIS plots of BiOI and 54 wt% BiOI/KTaO3 with and without visible light irradiation. | ||
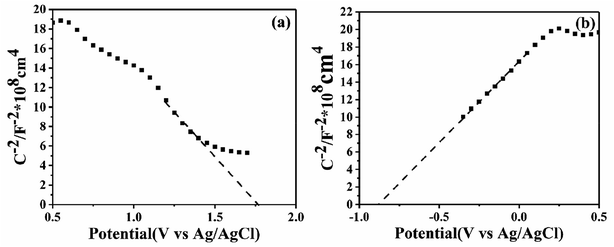
In order to confirm the semiconductor type of BiOI and KTaO3, the Mott–Schottky test was performed. As shown in Fig. 13a, the slope of the Mott–Schottky curve for BiOI showed negative, suggesting that BiOI was a p-type semiconductor, and this result is in agreement with that obtained in a previous report.23 Meanwhile, KTaO3 was proved to be an n-type semiconductor with a positive slope of the Mott–Schottky curve shown in Fig. 13b. To determine the position of the valence band (EVB) and conduction band (ECB) potential of BiOI as well as KTaO3, we followed the equations: EVB = X − E0 + 0.5Eg, ECB = EVB − Eg, where EVB and ECB represent valence band and conduction band edge potentials, respectively; X denotes absolute electronegativity and was determined by the composition of atoms; and E0 refers to the energy of free electrons on the hydrogen scale (about 4.5 eV vs. NHE). The X of BiOI was calculated to be 5.94 eV, while that of KTaO3 was 5.42 eV. According to the above-mentioned formula, the EVB and ECB values of BiOI were determined to be 2.32 and 0.56 eV, respectively, and those of KTaO3 were estimated to be 2.79 and −0.96 eV, respectively.
As shown in Fig. 14a, for BiOI, the Fermi level was close to the valence band (VB), while for KTaO3, it was close to the conduction band (CB). When KTaO3 was contacted with BiOI, the electrons transferred to BiOI from KTaO3 until the Fermi level got balanced. Hence, an inner electronic field was formed between KTaO3 and BiOI because of the difference in potential. When the composites were irradiated with visible light, only BiOI could be excited; the electrons jumped from the VB into the CB of BiOI, leaving holes on the VB of BiOI. Subsequently, the electrons, with the help of an inner electric field, were forced to transfer to the CB of KTaO3 (Fig. 14b), facilitating the separation and migration of photo-excited carriers. Therefore, the p–n heterojunction generated between BiOI and KTaO3 improved the separation efficiency of the photo-excited carriers (Fig. 14), resulting in a higher photocatalytic efficiency.
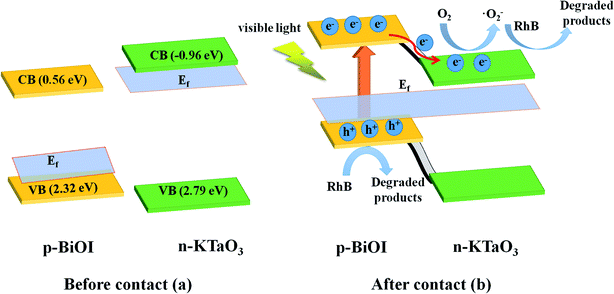 | ||
| Fig. 14 Schematic diagram of (a) the band energy of BiOI and KTaO3 before contact and (b) the formation of p–n junction and the charge transfer and separation process under visible light irradiation. | ||
4. Conclusions
In summary, p–n heterojunction BiOI/KTaO3 composite was successfully prepared through depositing BiOI nanosheets on the surface of the KTaO3 nanocubes. The BiOI/KTaO3 composites exhibited an enhanced photocatalytic property toward the photodegradation of RhB and phenol under the irradiation of visible light. When the loading amount of BiOI was 54 wt%, the BiOI/KTaO3 composites displayed the highest photocatalytic efficiency for the degradation of RhB and phenol. The improved photocatalytic performance could be ascribed to the successful construction of p–n junction between BiOI and KTaO3, which facilitates the separation and migration of photo-induced charge carriers, as verified by the results of PL, photocurrent response and EIS.Conflicts of interest
There are no conflicts to declare.Acknowledgements
We gratefully acknowledge the financial support of the Natural Science Foundation of Anhui Province (1908085QF293 and 1908085QA36) and Foundation of Educational Commission of Anhui Province (KJ2018A0394, KJ2018A0393, KJ2016SD51, KJ2016SD53 and KJ2019B14).References
- H. Liu, N. Gao, M. Y. Liao and X. S. Fang, Sci. Rep., 2015, 5, 7716 CrossRef CAS PubMed.
- F. Z. Wang, M. J. Zheng, C. Q. Zhu, B. Zhang, W. Chen, L. Ma and W. Z. Shen, Nanotechnology, 2015, 26(34), 345402 CrossRef PubMed.
- X. J. Xu, L. F. Hu, N. Gao, S. X. Liu, S. Wageh, A. A. Al-Ghamdi, A. Alshahrie and X. S. Fang, Adv. Funct. Mater., 2015, 25(3), 445–454 CrossRef CAS.
- L. Wang, P. X. Jin, S. H. Duan, H. D. She, J. W. Huang and Q. Z. Wang, Sci. Bull., 2019, 64(13), 926–933 CrossRef CAS.
- D. Sarkar, C. K. Ghosh, S. Mukherjee and K. K. Chattopadhyay, ACS Appl. Mater. Interfaces, 2013, 5(2), 331–337 CrossRef CAS PubMed.
- H. M. Zhang, C. H. Liang, J. Liu, Z. F. Tian, G. Z. Wang and W. P. Cai, Langmuir, 2012, 28(8), 3938–3944 CrossRef CAS PubMed.
- Z. Fang, L. Y. Long, S. H. Hao, Y. X. Song, T. T. Qiang and B. Y. Geng, Crystengcomm, 2014, 16(10), 2061–2069 RSC.
- X. J. Zou, Y. Y. Dong, X. D. Zhang and Y. B. Cui, Appl. Surf. Sci., 2016, 366, 173–180 CrossRef CAS.
- L. Wang, P. X. Jin, J. W. Huang, H. D. She and Q. Z. Wang, ACS Sustain. Chem. Eng., 2019, 7(18), 15660–15670 CrossRef CAS.
- H. D. She, Y. D. Sun, S. P. Li, J. W. Huang, L. Wang, G. Q. Zhu and Q. Z. Wang, Appl. Catal., B, 2019, 245, 439–447 CrossRef CAS.
- H. T. Wang, J. Mao, Z. W. Zhang, Q. Zhang, L. X. Zhang, W. Zhang and P. W. Li, Toxins, 2019, 11(2), 105 CrossRef CAS PubMed.
- J. Wu, Y. Y. Sun, C. H. Gu, T. Wang, Y. J. Xin, C. Chai, C. Y. Cui and D. Ma, Appl. Catal., B, 2018, 237, 622–632 CrossRef CAS.
- W. P. Zhang, G. Y. Li, W. J. Wang, Y. X. Qin, T. C. An, X. Y. Xiao and W. Y. Choi, Appl. Catal., B, 2018, 232, 11–18 CrossRef CAS.
- Y. F. Zhang and S. J. Park, J. Mater. Chem. A, 2018, 6(41), 20304–20312 RSC.
- H. D. She, H. Zhou, L. S. Li, Z. W. Zhao, M. Jiang, J. W. Huang, L. Wang and Q. Z. Wang, ACS Sustain. Chem. Eng., 2018, 7(1), 650–659 CrossRef.
- Y. Zheng, X. Zhang, J. Zhao and P. Yang, Appl. Surf. Sci., 2018, 430, 585–594 CrossRef CAS.
- X. J. Zou, Y. Y. Dong, X. D. Zhang, Y. B. Cui, X. X. Ou and X. H. Qi, Appl. Surf. Sci., 2017, 391, 525–534 CrossRef CAS.
- X. J. Wen, C. G. Niu, L. Zhang and G. M. Zeng, ACS Sustain. Chem. Eng., 2017, 5(6), 5134–5147 CrossRef CAS.
- Y. X. Guo, H. W. Huang, Y. He, N. Tian, T. R. Zhang, P. K. Chu, Q. An and Y. H. Zhang, Nanoscale, 2015, 7(27), 11702–117011 RSC.
- Y. W. Zhou, S. S. Fang, M. Zhou, G. Q. Wang, S. Xue, Z. Y. Li, S. Xu and C. Yao, J. Alloys Compd., 2017, 696, 353–361 CrossRef CAS.
- L. Yosefi, M. Haghighi and S. Allahyari, Sep. Purif. Technol., 2017, 178, 18–28 CrossRef CAS.
- M. Yan, Y. Q. Hua, F. F. Zhu, W. Gu, J. H. Jiang, H. Q. Shen and W. D. Shi, Appl. Catal., B, 2017, 202, 518–527 CrossRef CAS.
- X. J. Wen, C. G. Niu, L. Zhang and G. M. Zeng, Dalton Trans., 2017, 46(15), 4982–4993 RSC.
- S. M. Wang, Y. Guan, L. P. Wang, W. Zhao, H. He, J. Xiao, S. G. Yang and C. Sun, Appl. Catal., B, 2015, 168, 448–457 CrossRef.
- L. Yosefi and M. Haghighi, Appl. Catal., B, 2018, 220, 367–378 CrossRef CAS.
- J. C. Wang, H. C. Yao, Z. Y. Fan, L. Zhang, J. S. Wang, S. Q. Zang and Z. J. Li, ACS Appl. Mater. Interfaces, 2016, 8(6), 3765–3775 CrossRef CAS PubMed.
- H. W. Huang, Y. He, X. Du, P. K. Chu and Y. H. Zhang, ACS Sustain. Chem. Eng., 2015, 3(12), 3262–3273 CrossRef CAS.
- H. W. Huang, K. Xiao, Y. He, T. R. Zhang, F. Dong, X. Du and Y. H. Zhang, Appl. Catal., B, 2016, 199, 75–86 CrossRef CAS.
- Y. M. Xia, Z. M. He, J. B. Su, Y. Liu, B. Tang and X. P. Li, Nano, 2018, 13(6), 1850070 CrossRef CAS.
- K. H. Reddy, S. Martha and K. M. Parida, Inorg. Chem., 2013, 52(11), 6390–6401 CrossRef CAS PubMed.
- O. Mehraj, B. M. Pirzada, N. A. Mir, M. Z. Khan and S. Sabir, Appl. Surf. Sci., 2016, 387, 642–651 CrossRef CAS.
- L. Tang, C. Y. Feng, Y. C. Deng, G. M. Zeng, J. J. Wang, Y. N. Liu, H. P. Feng and J. J. Wang, Appl. Catal., B, 2018, 230, 102–114 CrossRef CAS.
- L. H. Huang, H. J. He, B. Zhang, S. Z. Tan and J. Z. Qi, J. Nanosci. Nanotechnol., 2018, 18(7), 4982–4986 CrossRef CAS PubMed.
- J. W. Shi and L. J. Guo, Prog. Nat. Sci.: Mater. Int., 2012, 22(6), 592–615 CrossRef.
- B. Modak and S. K. Ghosh, J. Phys. Chem. C, 2016, 120(13), 6920–6929 CrossRef CAS.
- Z. Q. Yong, J. Ren, H. L. Hu, P. Li, S. X. Ouyang, H. Xu and D. F. Wang, J. Nanomater., 2015, 2015, 1–7 CrossRef.
- Z. Q. Chen, P. X. Xing, P. F. Chen, Q. Q. Chen, Y. Wang, J. X. Yu and Y. M. He, Catal. Commun., 2018, 109, 6–9 CrossRef CAS.
- H. Hagiwara, N. Ono, T. Inoue, H. Matsumoto and T. Ishihara, Angew. Chem. Int. Ed., 2006, 118(9), 1448–1450 CrossRef.
- D. B. Xu, S. B. Yang, Y. Jin, M. Chen, W. Q. Fan, B. F. Luo and W. D. Shi, Langmuir, 2015, 31(35), 9694–9699 CrossRef CAS PubMed.
- B. Bajorowicz, J. Nadolna, W. Lisowski, T. Klimczuk and A. Zaleska-Medynska, Appl. Catal., B, 2017, 203, 452–464 CrossRef CAS.
- X. Q. Liu, J. J. Lv, S. Wang, X. Li, J. Y. Lang, Y. G. Su, Z. L. Chai and X. J. Wang, J. Alloys Compd., 2015, 622, 894–901 CrossRef CAS.
- L. Z. Ren, D. E. Zhang, X. Y. Hao, X. Xiao, Y. X. Jiang, J. Y. Gong, F. Zhang, X. B. Zhang and Z. W. Tong, Mater. Res. Bull., 2017, 94, 183–189 CrossRef CAS.
- C. Wang, M. M. Wu, M. Yan, H. Q. Shen, F. P. Cai, B. Hua and W. D. Shi, Ceram. Int., 2015, 41(5), 6784–6792 CrossRef CAS.
- B. Chai and X. Wang, RSC Adv., 2015, 5(10), 7589–7596 RSC.
- T. T. Wang, H. Meng, X. Yu, Y. Z. Liu, H. B. Chen, Y. Zhu, J. P. Tang, Y. X. Tong and Y. M. Zhang, RSC Adv., 2015, 5(20), 15469–15478 RSC.
- J. Jiang, X. Zhang, P. B. Sun and L. Z. Zhang, J. Phys. Chem. C, 2011, 115(42), 20555–20564 CrossRef CAS.
- Y. G. Su, J. Y. Lang, L. P. Li, K. Guan, C. F. Du, L. M. Peng, D. Han and X. J. Wang, J. Am. Chem. Soc., 2013, 135(31), 11433–11436 CrossRef CAS PubMed.
- Y. Peng, Q. G. Chen, D. Wang, H. Y. Zhou and A. W. Xu, CrystEngComm, 2015, 17(3), 569–576 RSC.
- I. E. Paulauskas, G. E. Jellison and L. A. Boatner, J. Mater. Res., 2010, 25(1), 52–62 CrossRef CAS.
- H. W. Huang, S. B. Wang, N. Tian and Y. H. Zhang, RSC Adv., 2014, 4(11), 5561–5567 RSC.
- Z. Q. Chen, P. F. Chen, P. X. Xing, X. Hu, H. J. Lin, Y. Wu, L. H. Zhao and Y. M. He, Fuel, 2018, 233, 486–496 CrossRef CAS.
- C. H. Wu, H. W. Chang and J. M. Chern, J. Hazard. Mater., 2006, 137(1), 336–343 CrossRef CAS PubMed.
- B. B. Zhang, D. F. Zhang, Z. S. Xi, P. F. Wang, X. P. Pu, X. Shao and S. J. Yao, Sep. Purif. Technol., 2017, 178, 130–137 CrossRef CAS.
- J. L. Lv, K. Dai, J. F. Zhang, Q. Z. Liu, C. H. Liang and G. P. Zhu, Sep. Purif. Technol., 2017, 178, 6–17 CrossRef CAS.
- L. S. Zhang, K. H. Wong, H. Y. Yip, C. Hu, J. C. Yu, C. Y. Chan and P. K. Wong, Environ. Sci. Technol., 2010, 44(4), 1392–1398 CrossRef CAS PubMed.
- Y. Zhao, X. Huang, X. Tan, T. Yu, X. L. Li, L. B. Yang and S. C. Wang, Appl. Surf. Sci., 2016, 365, 209–217 CrossRef CAS.
| This journal is © The Royal Society of Chemistry 2020 |

