
 Open Access Article
 This Open Access Article is licensed under a Creative Commons Attribution-Non Commercial 3.0 Unported Licence
Synthesis of a new potassium-substituted lead fluorapatite and its structural characterization†
Mariam Hamzaa,
Besma Hamdia,
Ali Ben Ahmed b,
Francesco Capitelli*c and
Hafed El Fekia
b,
Francesco Capitelli*c and
Hafed El Fekia
aUniversity of Sfax, Faculty of Sciences of Sfax, Laboratory of Materials Science and Environment, P. B. No. 1171-3000, Sfax, Tunisia
bUniversity of Sfax, Faculty of Sciences of Sfax, Department of Physic, Laboratory of Applied Physic, B. P. No. 802, 3018 Sfax, Tunisia
cInstitute of Crystallography–CNR, Via Salaria Km 29.300, 00016 Monterotondo, Rome, Italy. E-mail: francesco.capitelli@cnr.it
First published on 24th May 2024
Abstract
Prismatic crystals of partially potassium substituted lead fluorapatite Pb5.09Ca3.78K1.13(PO4)6F0.87 were grown through a solid-state reaction. The structural study conducted by single-crystal X-ray diffraction revealed that the compound crystallizes in the hexagonal P63/m space group, with unit cell parameters a = b = 9.7190(5) Å, c = 7.1700(6) Å and V = 587.37(7) Å3(Z = 1), as well as final values amounting to R and wR of 0.0309 and 0.0546, respectively. The structural refinement demonstrated that Pb occupies both the (6h) and (4f) structural sites of hexagonal fluorapatite, K occupies the (6h) site, and Ca is placed on the (4f) site. Powder X-ray diffraction study indicated the absence of additional phases or impurities. Chemical analysis using atomic absorption spectrometry and energy-dispersive X-ray spectroscopy confirmed the expected chemical formula. The electrical conductivity measured over a wide temperature range was found to be governed by the ion mobility mechanism in the tunnel along the c axis (probably attributed to the fluorine ion located there). We, therefore, could infer from the analysis of the complex impedance spectra that the electrical conductivity of our apatite depends essentially on the temperature and frequency, which produces a relaxation phenomenon and semiconductor-like behavior. Moreover, the strong absorption in the UV-Visible region was substantiated through studies of the optical properties of the developed sample. Fluorescence spectra exhibited emissions in the orange regions when excited at 375 nm. The findings of the phenomena resulting from the emission and conduction of the apatite in question suggest its potential for application in various technological fields such as photovoltaic cells, optoelectronics, photonics, LED applications, catalysis and batteries.
Introduction
The chemical and physical properties of Ca10(PO4)6(OH, F, Cl)2 apatite have been a hot topic of research, triggering significant scientific interest and whetting the widest interest owing to its occurrence as a geomaterial in many earth rocks1 and its presence as a biogenic mineral in vertebrate hard tissues such as teeth and bones.2,3 From this perspective, synthetic analogues of Ca10(PO4)6(OH)2 hydroxyapatite (HAp) and Ca10(PO4)6F2 fluorapatite (FAp), the most common terms of the apatite mineral group, are highly needed materials in terms of their potential use in a number of various applications in different technological contexts.4 These applications range from biological applications5,6 up to wider uses. For example, in the field of optics technology, they can serve as phosphors for fluorescent lamps,7,8 as sieves for water remediation,9 as coating materials for cultural heritage protection materials,10 etc.Such multiple applications are basically owing to the ability of the apatite family to diversify their chemical composition, essentially by accepting various chemical substitutions, both cationic and anionic.3,11,12 Notably, the apatite family is known by the general formula A10(TO4)6X2, where A represents a divalent cation (e.g. Ca2+, Sr2+, Pb2+), TO4 is generally a trivalent anionic group (e.g. PO43−, VO43−, AsO43−), and X is a monovalent anion (F−, OH−, Cl−).13–15 The most known crystallization arrangements for apatite compounds correspond to the hexagonal P63/m space group (no. 176), or, in rare cases, monoclinic settings.16,17 The structure of apatites is stabilized by negative and positive charge compensation, which takes place among certain anions consisting of an isolated TO4n− tetrahedron with large Am+ cations located on two sites: A(4f) with the coordination number 9, and A(6h) with the coordination number 7. There is a channel along the c axis resulting from how the A(6h) cations are located. This channel still arouses a spate of interest in apatite-type structures as it accommodates a column of X anions extending along the axis where these anions are located in different positions. From this perspective, this channel is equally considered an anionic tunnel.1 The apatite structure is characterized by its great ability to replace cations and anions. However, divalent calcium is usually replaced by a monovalent or trivalent cation, and the positive charge is balanced through substituting the trivalent phosphate group PO43− for a divalent, e.g. SO42−, or a tetravalent, e.g. SiO44−, group, respectively.18–21 Another mechanism of balance compensation in the case of trivalent cations substitution, as for rare earth cations (RE3+), lies in adopting the crystal formula Ca10−xREx (PO4)6Ox(X)2−x, where 0 ≤ x ≤ 2.22
Recent focus was devoted to lead apatite, initially owing to the biological occurrence of Pb in bone and teeth, hence the name “bone-scavenger”.23,24 Additionally from a structural point of view, Pb can occupy both the entire cations site, maintaining the general formula of the apatite, giving rise to lead hydroxyapatite, with the formula Pb10(PO4)6(OH)2.25 On the other hand, from a structural point of view, lead-substituted apatites are the only phases in the apatite family that allow the absence of a halogen site in the framework; in this case, the A10(TO4)6X2 structural formula moves to an M10(TO4)6 adapted formula, where M stands for a solid solution among monocationic and dicationic species, and such phases are known as ‘lacunary apatites’.26–28 The structure of apatite compounds is stabilized in this case by the electronic activity of the lone pair of lead 5s2, which is oriented towards the tunnel.26–28 Such a feature has oriented much research towards the study of the relationship between the structural properties and ionic conductivity by means of electrical measurements.26–29 Studies of FAp and HAp materials have revealed electrical properties that change behaviour with changing temperature,30–34 and this property itself varies for lead-containing apatites, which mainly refer to Pb–X interactions in the tunnel.26–29 The research results to date have indicated that FAp-based compounds are better ionic conductors than HAp-based ones.33 Study of the mechanism of the electrical conductivity in the Pb8K2−xNax(PO4)6 compound demonstrated that it was ionic conductivity, and was mainly associated with the change in the cations and anions in the apatitic structure. It is noteworthy that this change in cations and anions plays a pivotal role in terms of changing the size of apatite tunnels.31 Another important application of Pb-FAp compounds is in environmental protection, also owing to the occurrence of solid-solution Ca–Pb, favoured by the similarities of the Ca2+ and Pb2+ ionic radii.32
In the current research, in line with prior studies carried out on fluorapatite that have displayed good electrical properties, as reported by many scientists,31,33,34 we prepared calcium fluorapatite partially substituted by lead and potassium, whose chemical formula is: Pb5.09Ca3.78K1.13(PO4)6F0.87 (hence abbreviated in KPbFAp), followed by a multi-methodological characterization based on single-crystal and powder X-ray diffraction, atomic absorption and energy-dispersive X-ray spectroscopy for chemical analysis, Hirshfeld surface analysis, infrared, impedance, ultraviolet (UV-Visible) and fluorescence spectroscopies, and dielectrical measurements. The physico-chemical characterization of the synthesized compound allowed us to gain a deeper insight into the potential multiple technological applications in photonics, optoelectronics, LED applications, catalysis, and batteries.
Experimental
Synthesis
The synthesis of the title compound was undertaken according to the following general chemical formula: Pb(10−x−y)CaxKy(PO4)6F(2−y). The compound was obtained by sintering the following raw materials: K2CO3, CaF2, CaCO3, PbO and (NH4)2HPO4, mixed in stoichiometric quantities. The mixture was ground in an agate mortar for 30 min using an ammonia solution so as to avoid dust escape. It was then placed in a platinum crucible covered with a lid to be heated in a programmed oven. A series of grinding stages followed by heating was carried out until the reaction was completed. The transition from one heating stage to another occurred by increasing the temperature in 50 K steps to a limit of 1073 K. To grow the crystals, the resulting powder was heated at a rate of 5 K min−1 until 1173 K. Subsequently, it was left for 4 h at this temperature, and was then calcined by reducing the temperature at a rate of 1 K min−1. Although several values for x and y were tried, the only compounds that yielded single crystals that were large enough for structural study corresponded to x = 3.75 and y = 1.15.Atomic absorption spectroscopy
In order to assess the amount of elements present in the expected formula, we investigated Pb, Ca, K, F and P through the use of a PerkinElmer 560 atomic absorption spectrophotometer on powder samples. Verification of the amount of phosphate was performed colorimetrically relying upon Gee and Deitz's method.35X-ray energy-dispersive spectroscopy
The study by X-ray energy-dispersive (EDX) spectroscopy of the present fluorapatite was conducted using a PHILIPS XL 30 type microscope. The interactions of the incident electrons with the atoms of the sample to be analyzed entailed the emission of a spectrum made up of a series of monochromatic lines. The spectrum, therefore, allowed us to identify the elements present in the volume bombarded by the electron flow. The sample was placed, by gluing with silver lake to ensure conduction, on a goniometric plate that allowed different modes of rotation and translation.Single-crystal X-ray diffraction
For the structural study of the title compound through single-crystal X-ray diffraction (SCXRD), we utilized a Bruker Kappa CCD Apex II diffractometer with graphite monochromatized (MoKα radiation, λ = 0.71073 Å, Bruker AXS Inc., Madison, WI, USA (2008)). We opted for collecting the diffraction intensity of a suitable single crystal of good quality, with dimensions of 0.42 × 0.14 × 0.12 mm3. Each peak of the pattern was indexed with an apatite cell, indicating a single-phase crystalline compound. The compound crystallized in the hexagonal P63/m (no. 176) space group with unit cell parameters: a = 9.7190(5) Å, c = 7.1700(6) Å, and V = 587.37(7) Å3.The parameters used for the intensity measurements as well as the crystal data are outlined in Table 1 along with the results and convergence parameters of the crystal structure determination. The positions of the cation sites that were initially occupied by the Pb cations were located using the Patterson method included in the SHELXS-97 program.36 The positions of P and O were deduced from the Fourier summation maps generated during the refinement process and analyzed with the SHELXL-2016/6 program.37 The main difficulty encountered during the determination of the structure stemmed from the distribution of the cations Pb2+, Ca2+, and K+ in the (6h) and (4f) sites. In this regard, it is worth noting that the cations Ca2+ and K+ are isoelectronic. Fourier synthesis indicated that the electron density at the (4f) site comprised fewer electrons than at the (6h) site. For this reason, potassium was mainly localized at the (4f) site. Subsequent refinements then made it possible to obtain quantities of calcium and lead at both sites. The quantity of K was obtained by using the electroneutrality constraint. The whole K amount was assumed to be present at the (6h) site, but the same quality of refinement was obtained with K at the (4f) site, suggesting that it was impossible to distinguish K+ and Ca2+ with this technique, since they are isoelectronic. Nevertheless, the final refined formula was determined in terms of Pb5.09Ca3.78K1.13(PO4)6F0.87. The structural graphics of the title apatite were created with the CrystalMaker38 and DIAMOND programs.39
| a wR2 = (∑[W(Fo2 − Fc2)2/[w(Fo2)2]1/2]), R1 = ∑||Fo| − |Fc||/∑|Fo|, where W = 1/[σ2(Fo2) + (0.045P)2 + 1.18P] and P = (Fo2 + 2Fc2)/3. | |
|---|---|
| Chemical formula | Pb5.09Ca3.78K1.13(PO4)6F0.87 |
| Formula weight (g mol−1) | 1836.68 |
| Crystal system | Hexagonal |
| Space group | P63/m (no. 176) |
| a (Å) | 9.7190(5) |
| c (Å) | 7.1700(6) |
| V (Å3) | 587.37(7) |
| Z | 1 |
| Densitycal (g·cm−3) | 5.192 |
| F (000) | 804.3 |
| μ (mm−1) | 37.90 |
| Morphology | Prismatic |
| Crystal colour | Colourless |
| Crystal size (mm3) | 0.42 × 0.14 × 0.12 |
| Temperature (K) | 293(2) |
| Wavelength (Å) | 0.71073 |
| θ Range (°) | 3.73–35.01 |
| Range of h, k, l | −15 ≤ h ≤ 4; −6 ≤ k ≤ 15; −11 ≤ l ≤ 11 |
| Total unique reflections | 923 |
| Rint | 0.082 |
| Tmin; Tmax | 0.237; 0.326 |
| Unique refl. I > 2σ(I) | 673 |
| Refined parameters | 45 |
| R; wR2 | 0.0309; 0.0546 |
| Goodness of fit | 0.972 |
Further details of the structural refinement were stored in a crystallographic information file (CIF) deposited at the Cambridge Crystallographic Data Centre as Supplementary Publications (ICSD-deposition number 2322143). Data can be obtained at http://www.ccdc.cam.ac.uk/conts/retrieving.html or from Cambridge Crystallographic Data Centre, 12 Union Road, Cambridge CB2 1EZ, United Kingdom; fax: +44 1223 336 033; E-mail: E-mail: deposit@ccdc.cam.ac.uk.
Powder X-ray diffraction
In order to conduct the qualitative study of the KPbFAp apatite-based compound and to ensure the absence of additional phases, powder X-ray diffraction (PXRD) investigation was carried out on powder samples using a two-circle X-ray diffractometer, Seifert 3000 TT. The source of the X-ray generated by a copper anticathode was supplied by a stabilized generator operating at 45 kV and 40 mA and the used radiation was Kα1 of copper (λ = 1.5418 Å). The diffractometer operated in the θ–θ mode allowing measurement of diffracted intensities versus θ. Indication of the PXRD data, via the Fullprof interface,40 allowed obtaining he unit cell parameters a = b = 9.7144(2) Å, and c = 7.1730(2) Å.Hirschfeld surface analysis
The Crystal Explorer program41 was used to compute the molecular Hirshfeld surfaces resting on the X-ray structural analysis. The construction of the Hirshfeld surfaces in the crystal structure relied on the electron distribution, which corresponded to the sum of the electron densities of spherical atoms.42 The Hirshfeld surface offers the chance to gain a better insight into how molecular crystals interact with one another for a particular crystal structure and a collection of spherical atomic electron densities. When intermolecular interactions are shorter or longer than the rvdW, the value of dnorm is either negative or positive. When presenting the dnorm value, this technique uses three colours: red for shorter contacts, white for contacts close to the van der Waals (vdW) separation, and blue for longer contacts.Infrared spectroscopy
Fast Fourier transform infrared (FTIR) spectroscopy was performed using a PerkinElmer FT-IR 1725X spectrometer. In order to prepare the sample, 5 mg of fluorapatite powder sample was mixed with 95 mg of KBr (dried at 110 °C overnight), before pressed into a disc shape. The spectrum was acquired in the range 400–4000 cm−1.UV-Visible spectroscopy
UV-visible absorption analysis of our compound was carried out using the HITACHI U-3300 UV-visible spectrophotometer. The measurements were determined within the 190–800 nm wavelength range. The fluorescence spectrum was recorded with 375 nm excitation.Photoluminescence spectroscopy
In order to investigate the photoluminescence (PL) properties of the title compound, emission analysis was undertaken using a time-resolved Edinburgh Instruments FLSP920 spectrofluorometer with a Red-PMT detector, with a Xe bulb as the excitation source.Conductivity measurements
With the aim of determining the type of conduction and the nature of the charge carriers in our sample, electrical measurements were carried out by impedance spectroscopy. The frequency range was [5 Hz–5 MHz], using an HP4192A impedance meter. The sample was pressed into the form of a compact disc under a pressure of 3 t cm−2. The dimensions of the obtained disc amounted to 8.0 mm in diameter and 0.3 mm in thickness. These dimensions were specified using the calliper, while electrical contacts were obtained through coating both opposite faces with a platinum paste. The measurements were carried out every 10 K between 293 K and 1120 K, with the pellet being maintained at a constant temperature during the measurement.Results and discussion
Atomic absorption spectroscopy
Bibliographic research revealed that the most commonly used method for preparing fluoroapatite was the dry method.43,44 Thus, the used reagents were metal oxides or carbonates, while the phosphate was provided by diammonium hydrogen phosphate. In the case of halogenated compounds, the halogen was supplied during the synthesis in the form of calcium salt. The chemical analyses from the atomic absorption results allowed us to determine the formula of our apatite, which was slightly different from the one calculated and prepared from the reagents during the synthesis: Pb5.12Ca3.79K1.09(PO4)6F0.89 instead of Pb5.10Ca3.75K1.15(PO4)6F0.85. Table 2 incorporates the chemical analysis results and the corresponding chemical formulas. The results of the quantitative analyses allowed us to obtain an atomic ratio (Pb + Ca + K)/P equal to 1.67, corresponding to the value typically observed in apatites (10/6 = 1.667).3| Element | Calculated | Experimental |
|---|---|---|
| a Values are provided in mass% with an absolute error of 0.02. Calculated values are derived from the expected formulas. | ||
| Pb | 57.49 | 57.59 |
| Ca | 8.18 | 8.25 |
| K | 2.45 | 2.31 |
| P | 10.11 | 10.09 |
| (PO4) | 31.00 | 30.93 |
| F | 0.88 | 0.92 |
| Expected formula | Pb5.10Ca3.75K1.15(PO4)6F0.85 | |
| Experim. formula | Pb5.12Ca3.79K1.09(PO4)6F0.89 | |
EDX spectroscopy
The analysis conducted by EDX spectrometry clarified, as far as the title apatite is concerned, how the wavelength of each line emitted was characteristic of the electronic structure of an atom constituting our compound, as reported in Fig. 1. This spectrum allowed us to identify the elements present in the volume bombarded by the electron flow.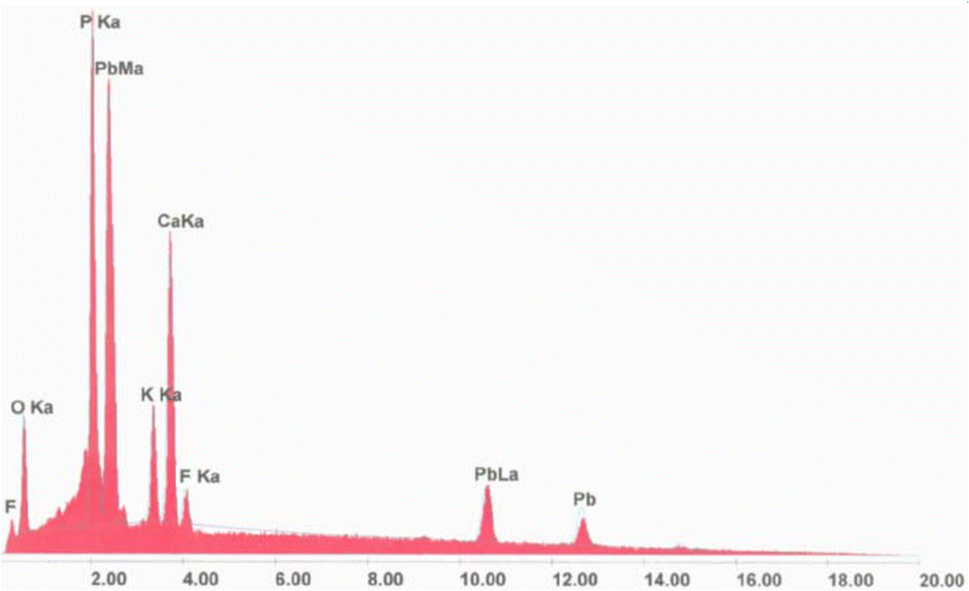 | ||
| Fig. 1 Energy-dispersive X-ray spectrum of KPbFAp. | ||
Powder X-ray diffraction
The qualitative interpretation as well as the purity of the title sample were checked by PXRD. Inspection of the X-ray diffractogram, as shown in Fig. 2, indicates that all the peaks were indexable to the hexagonal system, according to the pertinent apatite entry in the PDF-2 database (00-089-6438).45 This highlights the purity of the sample, without the occurrence of additional phases. The crystallographic parameters calculated from the powder X-ray diffraction corresponded to a = 9.7144(2) Å, c = 7.1730(2) Å. These parameters were in good agreement with those found through SCXRD (Table 1). The detected limit is ascribed to the accuracy of the devices.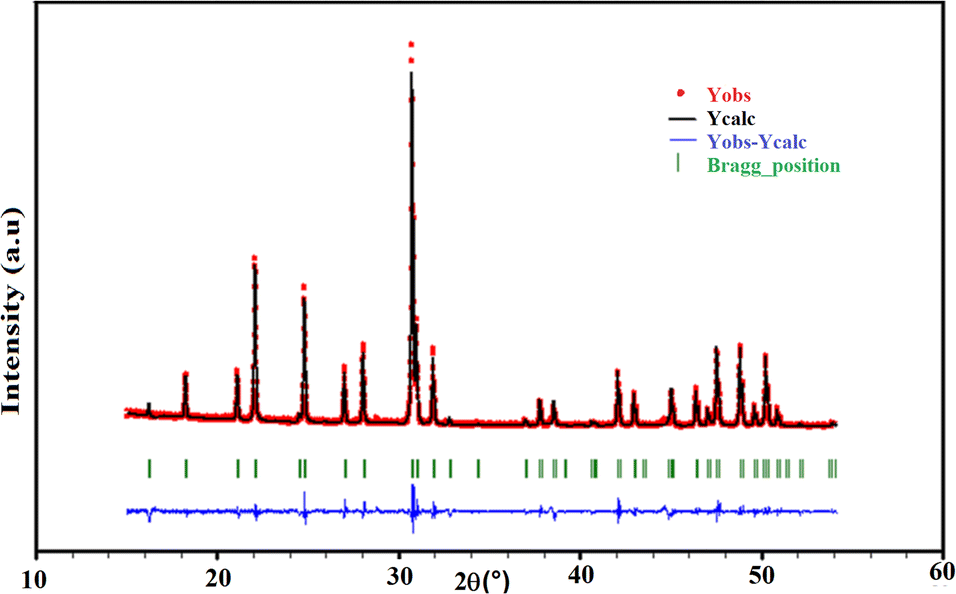 | ||
| Fig. 2 Observed (red), calculated (black), and difference (blue) profiles of the powder diffractogram of the KPbFAp compound, together with the Bragg positions (green) of the reference apatite from the PDF-2 database (00-089-6438).45 | ||
Single-crystal X-ray structure
Apatites display interesting physical and chemical properties, and a reliable technique to thoroughly study them is SCXRD. The structural resolution performed on a crystal of the obtained product allowed us to determine the following formula for our apatite: Pb5.09Ca3.78K1.13(PO4)6F0.87. It is therefore noteworthy that during the structural resolution, the difficulty encountered was the isoelectronics of the Ca2+ and K+ ions, making it hard to distinguish Ca and K atoms. The results of the chemical elemental analyses helped to address the structural refinement towards reliable values of Ca- and K- atoms per formula unit (apfu). Thus, the distribution of ions on the sites makes the [Pb4.87K1.13](6h)[Ca3.78Pb0.22](4f)(PO4)6F0.87 crystal formula vary up to [Pb4.87Ca1.13](6h)[Ca2.65K1.13Pb0.22](4f)(PO4)6F0.87.However, the amounts of calcium and potassium were determined by the electroneutrality constraint. Notably, when M+ ions are substituted for M2+ ions, a charge compensation mechanism occurs and a process may be invoked. From this perspective, we used the following equation M2+ + F−→ M+ +□F−, which simply implies when replacing K+ with Ca2+, a charge compensation mechanism occurs through the introduction of anion vacancies.
The final fractional atomic coordinates are displayed in Table 3 along with the parameters related to the isotropic thermal transformation.
| Site | x | y | z | Ueq (Å2) | sof | apfu | |
|---|---|---|---|---|---|---|---|
a τ: 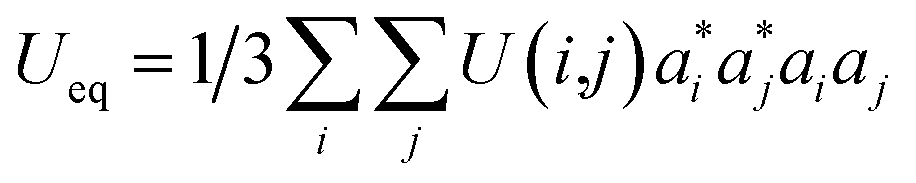 . . |
|||||||
| Pb2 | 6h | 0.25150(3) | 0.25375(3) | 1/4 | 0.01948(11) | 0.811(5) | 4.87 |
| K | 6h | 0.25150(3) | 0.25375(3) | 1/4 | 0.01948(11) | 0.189(5) | 1.13 |
| Ca | 4f | 2/3 | 1/3 | 0.49503(18) | 0.0173(4) | 0.944(2) | 3.78 |
| Pb1 | 4f | 2/3 | 1/3 | 0.49503(18) | 0.0173(4) | 0.056(2) | 0.22 |
| P | 6h | 0.59023(19) | 0.61749(19) | 1/4 | 0.0155(4) | 1 | 6 |
| O3 | 12i | 0.6470(4) | 0.7261(4) | 0.0785(5) | 0.0253(8) | 1 | 12 |
| O2 | 6h | 0.6462(5) | 0.5002(5) | 1/4 | 0.0251(11) | 1 | 6 |
| O1 | 6h | 0.4107(6) | 0.5352(5) | 1/4 | 0.0339(14) | 1 | 6 |
| F | 2a | 0 | 0 | 1/4 | 0.043(5) | 0.434(15) | 0.87 |
The present Pb5.09Ca3.78K1.13(PO4)6F0.87 compound is isotopic with other fluorapatite refinements reported in the literature,1 with the cationic sites (6h) and (4f) occupied, respectively, by Pb and K (hence M(6h)), and by Pb and Ca (hence M(4f)); P lay at another (6h) site, with two oxygen atoms on other (6h) sites, one oxygen at a general position (12i), and fluorine on a (2a) site (Table 3). An overview of the structure along [001] is provided in Fig. 3. The crystal formula can be indicated as [(M(4f))4(M(6h))6](PO4)6F2, and the FAp framework resembles a lattice made up of arrays of face-sharing M(4f)O9 polyhedra, corner-connected to PO4 groups down the c crystallographic axis. The result of this arrangement refers to the formation of one-dimensional cavities filled by [(M(6h))6F2]10+ moieties. Indeed, such cavities provide the apatite with a zeolite-like character, owing to the presence of cavities typical of these alumino silicates.46 The M(4f)O9 polyhedron is ideally built up by nine M–O bond distances up to 2.8 Å. After this threshold, the further three symmetry-related M–O distances are considered interactions, contributing to stabilize the framework. The FAp lattice presents an ideal stoichiometry [(M(4f))4(PO4)6]10−, balanced by [(M(6h))6F2]10+ moieties located in the hexagonal cavities. In case of lead and potassium replacement, the apatite formula can be notably considered in terms of Pb10−x−yCaxKy(PO4)6F2−y (x ranges between 0 and 10; y ranges between 0 and 2). If x = 0 and y = 2, the formula becomes Pb8K2(PO4)6,47 and it is a lacunary apatite; for x = 8 and y = 2, the formula is denoted as Ca8K2(PO4)6, (hypothetical); for y = 0, and x = 0 the formula pertains to Pb10(PO4)6F2 lead fluorapatite;48,49 for x = 10 and y = 0, the formula becomes that of Ca10(PO4)6F2,50–52 the well-known structure of fluorapatite. It is interesting to check whether or not the formed compounds are integrated into the corresponding solid solutions from the boundaries made up of Pb8K2(PO4)6 and Ca10(PO4)6F2.
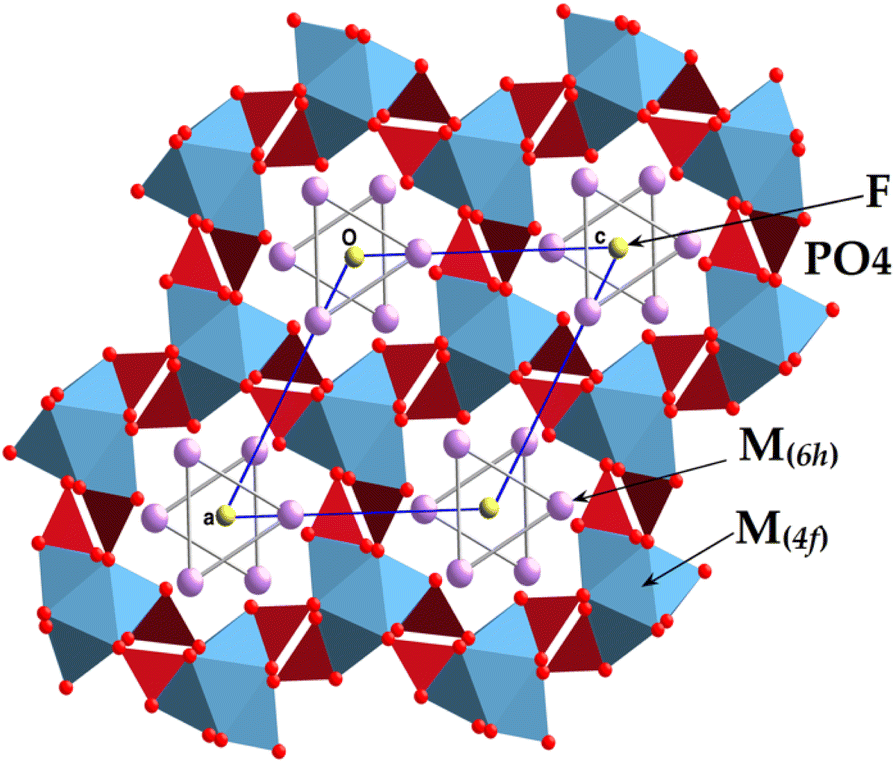 | ||
| Fig. 3 View of the structure of the KPbFAp apatite. | ||
Table 4 depicts the bond lengths for the cationic (4f) and (6h) sites, bond lengths and angles within the tetrahedral (PO4) groups, as well as selected cation–cation interaction distances. The atoms of O1 oxygen and O2 are joined to an atom M(6h) and to two atoms M(4f). However, the distances M(4f)–O2 are shorter than those of M(6h)–O2, whereas the distances M(4f)–O2 are longer than those of M(6h)–O1 (Table 4). The P–O2 short connection is associated with O2–M(6h) distances long and reciprocally, with long P–O1 connections at distances with short O1–M(6h). The study of (PO4) group in similar compounds has already been undertaken in the following references;11,12,53 whereby the P–O distances are those normally found in apatite3,7,15 or in inorganic phosphate structures,54,55 while the deformation of the PO4 tetrahedron is hypotizable with respect to the average O–P–O angle = 109.4° (Table 4) (the highest offset is 3.2°).
| a M(6h): Pb or K; M(4f): Pb or Ca.b Symmetry codes: I: −y + 1,x − y,z; II: −x + y + 1,−x + 1,z; III: x − y + 1,x,−z + 1; IV: y,−x + y,−z + 1; V: −x + 1,−y + 1,−z + 1; VI: y,−x + y,z + 1/2; VII: x − y + 1,x,z + 1/2; VIII:−x + 1,−y + 1,z + 1/2; IX: −x + 1,−y + 1,−z; X: −x + y,−x + 1,z; XI: −x + y,−x + 1,−z + 1/2; XII: −x + y,−x,z; XIII: −y,x − y,z; XIV: y,−x + y,−z; XV: x − y,x,−z; XVI: x − y,x,−z + 1; XVII: x,y,−z + 1/2; XIIX: −y + 1,x − y + 1,z; XIX: −x + 1,−y + 1,z − 1/2. | |||
|---|---|---|---|
| PO4 group | |||
| P–O1 | 1.514(5) | P–O3 | 1.533(3) |
| P–O2 | 1.490(5) | P–O3XVII | 1.533(3) |
| O1–P–O2 | 111.2(3) | O1–P–O3s17 | 106.7(2) |
| O2–P–O3XVII | 112.6(2) | O3–P–O3XVII | 106.7(2) |
| O3–P–O2 | 112.6(2) | O1–P–O3 | 106.7(2) |
![[thin space (1/6-em)]](https://www.rsc.org/images/entities/char_2009.gif) |
|||
| Cationic site (6h) | |||
| M(6h)–O2IV | 3.077(5)° | M(6h)–O3s10 | 2.622(3)° |
| M(6h)–O3IX | 2.522(3)° | M(6h)–O1 | 2.378(4)° |
| M(6h)–O3VIII | 2.522(3)° | M(6h)–O3XI | 2.622(3)° |
| M(6h)–F | 2.4576(3)° | ||
|
|||
| Cationic site (4f) | |||
| M(4f)–O1III | 2.551(4) | M(4f)–O3VI | 2.870(4) |
| M(4f)–O1IV | 2.551(4) | M(4f)–O3VII | 2.870(4) |
| M(4f)–O1V | 2.551(4) | M(4f)–O3VIII | 2.870(4) |
| M(4f)−O2I | 2.466(3) | ||
| M(4f)–O2II | 2.466(3) | ||
| M(4f)–O2 | 2.466(3) | ||
|
|||
| Cation–cation distances | |||
| M(6h)⋯MXII(6h) | 4.2568(5) | M(4f)⋯M(4f) | 3.512(2) |
| M(4f)⋯M(4f) | 3.655(2) | ||
The oxygenated environment of the site (4f) presents a prism trigonal tricapped shape. These prisms are piled up according to the [001] direction. The unique influence of the free pair of electrons of the ions of Pb2+ is indicated by the shift of the cation to the centre of the cavity d = 0.0715 Å. This entailed two different distances M(4f)–M(4f) according to the [001] direction. Moreover, short distances O1–O1 correspond to the M(4f)–M(4f) short distance and O2–O2 long distances at the M(4f)–M(4f) long distance. This implies that the size of the M(4f)–(O1)3–M(4f) cavity is smaller than that of M(4f)–(O2)3–M(4f). This observation leads us to suppose that the free pairs of electrons of Pb2+ cations are in the second cavity, and the free electron pairs are absent in the first cavity (Fig. 4).
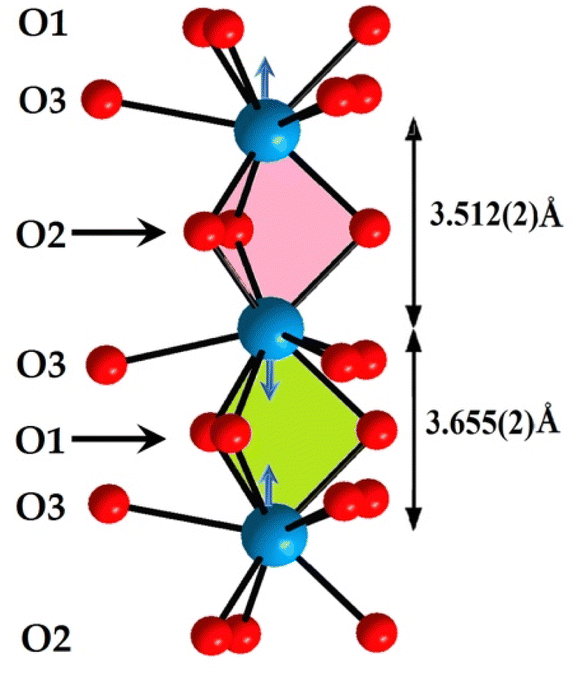 | ||
| Fig. 4 Two different M(4f)–M(4f) distances according to [001] direction, owing to the free pair electrons of Pb2+ ions: M(4f)–(O1)3–M(4f) cavity is smaller than that of M(4f)–(O2)3–M(4f). | ||
The cations, localized at the (6h) site, form triangles. In the KPbFAp compound, fluorine is placed in the centre of the triangle. To shun a repulsive interaction with the free pairs of lead, one can suppose that it is placed in the middle of the triangles of the K and/or Ca of the (6h) site. This last proposal seems more plausible. As a general remark, we can state that the present KPbFAp compound is a partially anionic lacunary apatite52 stabilized by the fluorine.
Hirshfeld surface analysis
To visualize the environment of (4f) and (6h) cationic sites, we present in Fig. 5 the Hirshfeld surface using dnorm. This figure indicates that the dominant colour is red followed by a little white, which is completely normal since the bonds that form inorganic groups are notably covalent or ionic, which is a type of chemical bonds that involve electrostatic attraction among ions of opposite charge.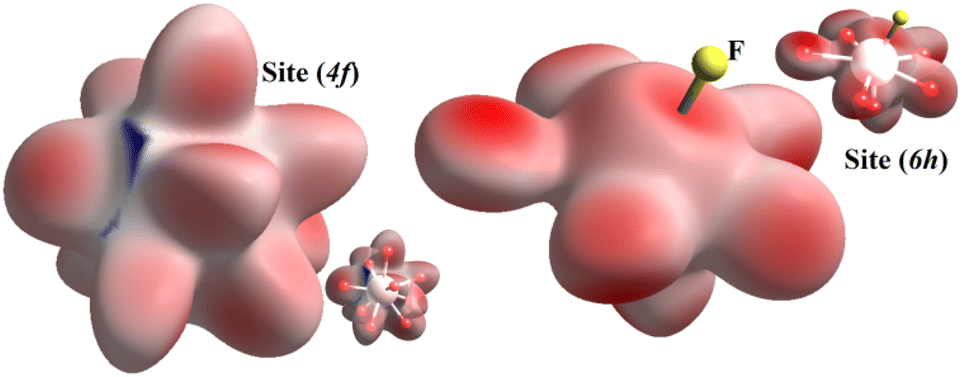 | ||
| Fig. 5 Hirshfeld surface analysis dnorm of (4f) and (6h) sites of KPbFAp compound. | ||
FTIR investigation
The results of the FTIR spectroscopy are summarized in Fig. 6. The obtained spectrum did not contain vibrations of OH, H2O, or CO3 groups within the range 1400–4000 cm−1.11,12,14 The lack of carbonate groups was further evidence that the preparation method relying on a series of calcinations led to the complete elimination of all the CO2 molecules present in the primary products. Consequently, no carbonates remained in the compound. In the spectrum, only four distinct bands of the tetrahedral phosphate group were recorded, despite the expected nine active modes.53 This could be ascribed basically to the low accuracy obtained through these transmission measurements. The four bands consisted of two large regions at 1200–800 cm−1 and 600–400 cm−1 corresponding, respectively, to ν1 and ν3 stretching modes and ν2 and ν4 bending modes. The results are illustrated in Table 5.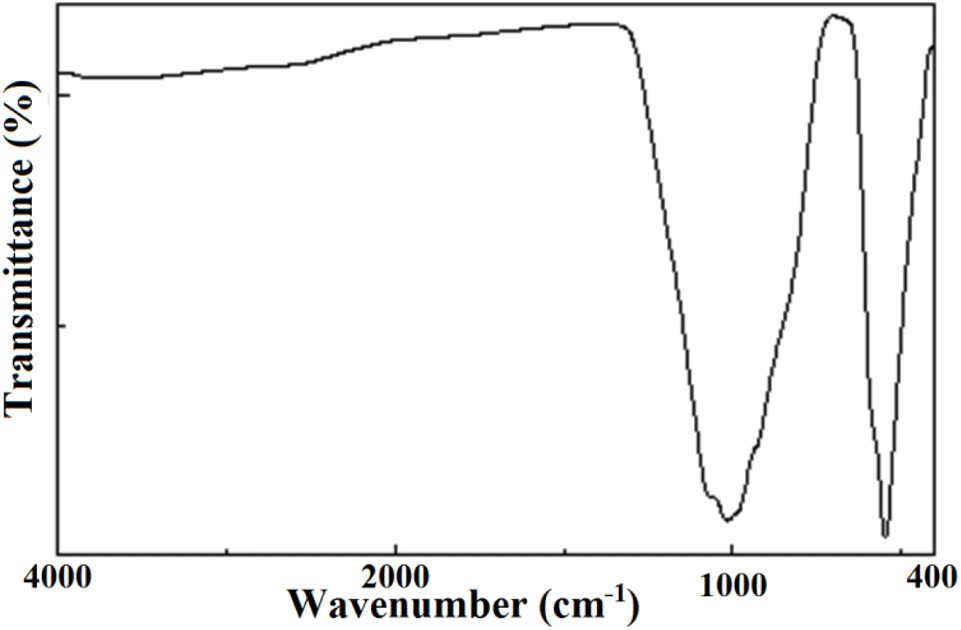 | ||
| Fig. 6 FTIR transmission spectrum of the KPbFAp compound. | ||
| Frequency | Mode | Assignment |
|---|---|---|
| 1064–1010 | ν1 | Symmetric stretching of (PO4)3− |
| 928 | ν2 | Symmetric bending of (PO4)3− |
| 578 | ν3 | Antisymmetric stretching of (PO4)3− |
| 544 | ν4 | Antisymmetric bending of (PO4)3− |
Conductivity measurements
With temperatures lower than 800 K, the conductivity seemed to be too weak to be measured. Hence, only the diagrams of impedance at temperatures higher than this will be considered. The dependence of electric conductivity according to the temperature between 750 K and 1120 K is presented in Fig. 7 through supposing that the law of dependence is an Arrhenius type. Given that the curve is a linear straight line, the energy of the corresponding activation was 0.57 eV. The variation in the complex impedance at various frequencies is provided in Fig. 8.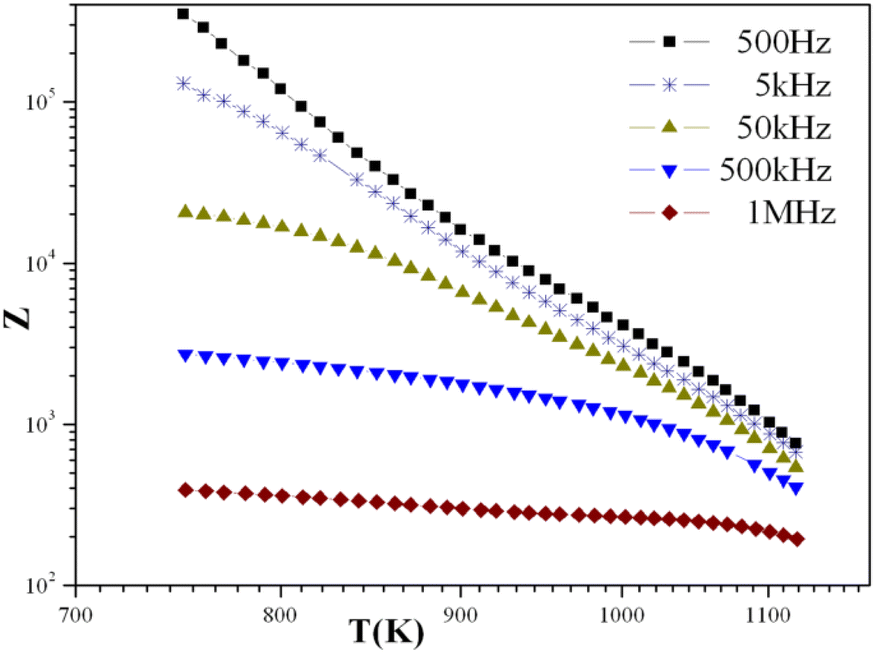 | ||
| Fig. 7 Variation of complex impedance at different frequencies as a function of temperature for the KPbFAp compound. | ||
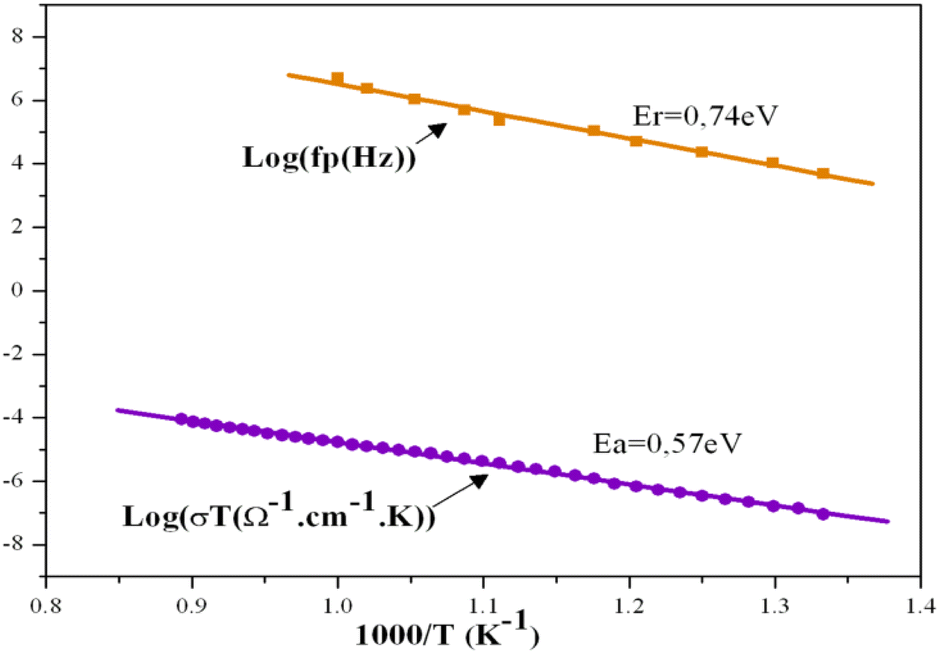 | ||
Fig. 8 Variation of log(fp) relating to standardized 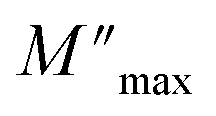 and of log(σT) according to 1000/T. and of log(σT) according to 1000/T. | ||
Departing from the measurements of impedance, the diagrams of log(M′) and the standardized imaginary part of the complex module, 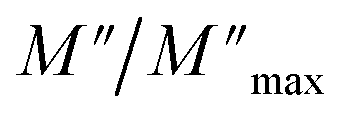 , according to the logarithm of the frequency of measurement were obtained for the sample Pb5.09Ca3.78K1.13(PO4)6F0.87. The results at various temperatures are outlined in Fig. 9 and 10. The value of M′ tightened towards a constant value
  of high frequency whatever the temperature.
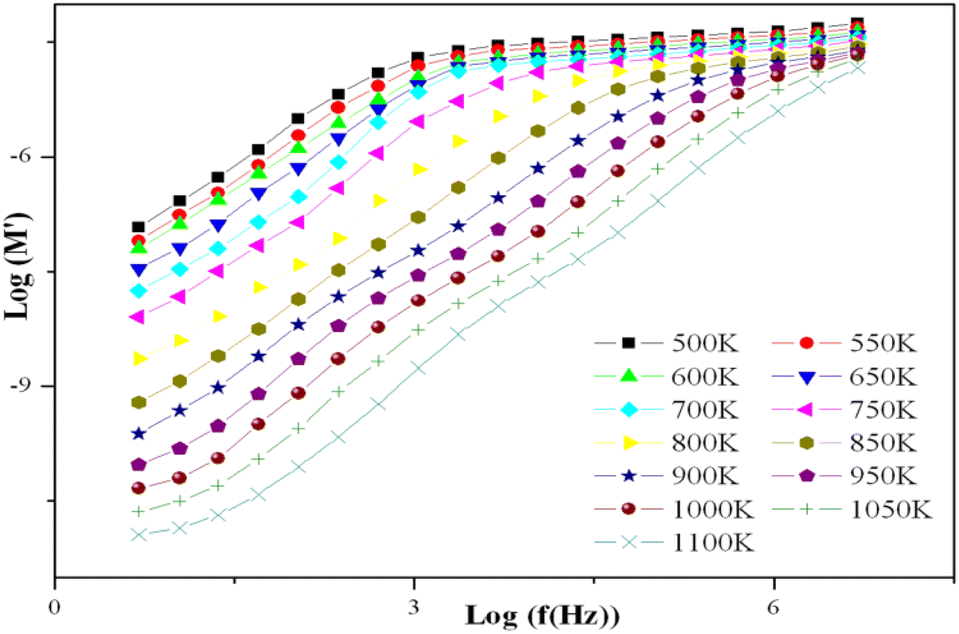 | ||
| Fig. 9 Variation of log(M′) according to log(f) for the KPbFAp compound. | ||
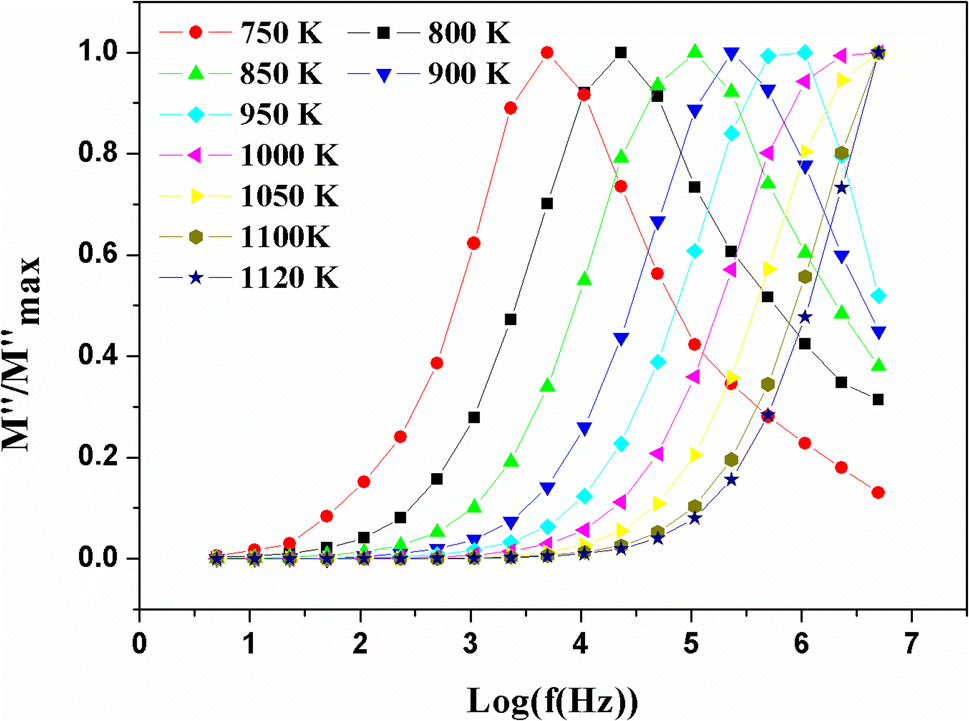 | ||
Fig. 10 Variation of the standardized imaginary part  , according to the frequency at different temperatures. , according to the frequency at different temperatures. | ||
At low frequency, it approached zero. With respect to the conducted experiments, the process of conductivity became significant only at high temperature. Therefore, one has to expect an exclusively ionic conduction. Moreover, this was confirmed through the colourless and transparent colour of the compounds, which is characteristic of a compound that is neither metal nor conducting for electronics. Ionic conduction is governed by the jumps of ions, which thus supposes the existence of vacant sites to receive mobile ions. We already have these vacant sites in our structure, located on the c axis, which facilitates the mobility of fluoride ions along this axis.
The energy of activation found for the compound KPbFAp, ΔEa = 0.57 eV, was slightly lower than that determined by the module complexes ΔEr = 0.74 eV (Fig. 8). No change in terms of slope for the Arrhenius curve (Fig. 8) was recorded, which indicates that our apatite revealed neither a phase transition, nor a change in the conduction mechanism. The bibliographic study revealed that fluoroapatite electrolytes are marked by the conduction process that occurs when fluoride ions move along the c axis of the unit cell. These ions are the only candidates for this process, and can move to other positions by creating thermally activated defects, such as Schottky defects. In our case, this phenomenon could occur, especially since our apatite contained anionic vacancies on the c axis. In other words, the conductivity of KPbFAp was particularly ensured by jumping ions;56,57 where fluoride ions were the only charge carriers.58,59 This energy of activation ΔEa was lower than that provided in the fluorapatite containing lithium (ΔEa = 1.64 eV),24 in which the authors conclude that it was the mobility of the fluoride ions along the c axis that was the dominating factor for the conductivity, with the contributions of the Pb2+ being negligible.29,32,53 The study carried out by Laghzizil et al. (2001) examined the conductivity of the following fluorapatites, where the conductivity of fluorine ions was ensured: M10(PO4)6F2 (where M = Ca, Ba), which displayed, respectively, activation energies of 1.86 and 1.47 eV, whereas the Pb10(PO4)6F2 compound, which showed a transition at 480 °C, displays activation energies of respectively 0.25 and 1.36 eV before and after this transition.34
It is possible to use fluorapatite as a solid electrolyte in combustion cells. FAp compounds play a dual role: (i) they facilitate the migration of ions from one electrode to another; (ii) they allow the physical separation of both anodic and cathodic compartments. The operating temperature of the battery will be determined by the type of electrolyte used. In the present case, the conduction temperature was 800 °C. In the bibliography, it was reported that when conductivity is driven by temperature, it is possible to use apatite-type electrolytes in fuel cells.60,61 Additionally, it is stated that the stoichiometric or partially lacunar apatites have a conductivity that is ensured by the anion located along the c axis. In the present fluorapatite, the conductivity was ensured by the mobility of the F− ions. Moreover, certain rare earth-based oxyapatites have a conductivity similar to that of the investigated FAp, whose fluorine, located on the c axis of the tunnel, is responsible for the conductivity. There are multiple forms of FAp whose conductivity is activated by heat between 600 °C and 1000 °C; for example, rare-earth strontium fluorapatite, whose conductivity is thermally activated at a temperature range of around 750–780 °C.62,63 Additionally the conductivity of Sr8Gd2−xNdx(PO4)4(SiO4)2F2 (0 ≤ x ≤ 2) apatite was activated around 748 °C.64
Optical properties: UV-Vis and fluorescence
The UV-Visible spectrum of the developed sample is shown in Fig. 11. The data were plotted as a function of wavelength (190–800 nm). From this spectrum, we notice two distinguished peaks in the UV region centred at λ1 = 250 nm and λ2 = 284 nm, which represent the two most sensitive lines for Pb.65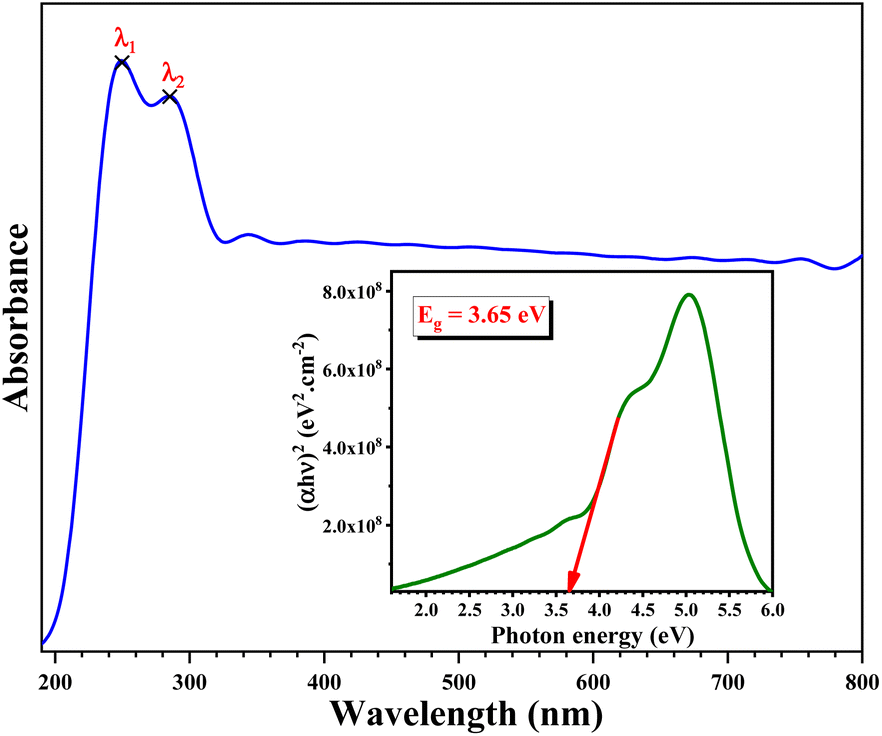 | ||
| Fig. 11 UV-visible absorption spectrum; inset, Tauc plot of KPbFAp. | ||
Using the Tauc method, the inset in Fig. 11 shows the plot of the optical band gap energy value of the synthesized sample. This value was estimated to be Eopt = 3.65 eV.66
Fluorescence spectroscopy is used to characterize the ability to consume the absorption of solar energy by the fluorescence emission of materials. The fluorescence spectrum of the developed sample is exhibited in Fig. 12. The fluorescence spectrum displayed a wide fluorescence band from 380 nm to 750 nm. When excited with 375 nm light, the developed sample exhibited orange emission in the aggregated states.
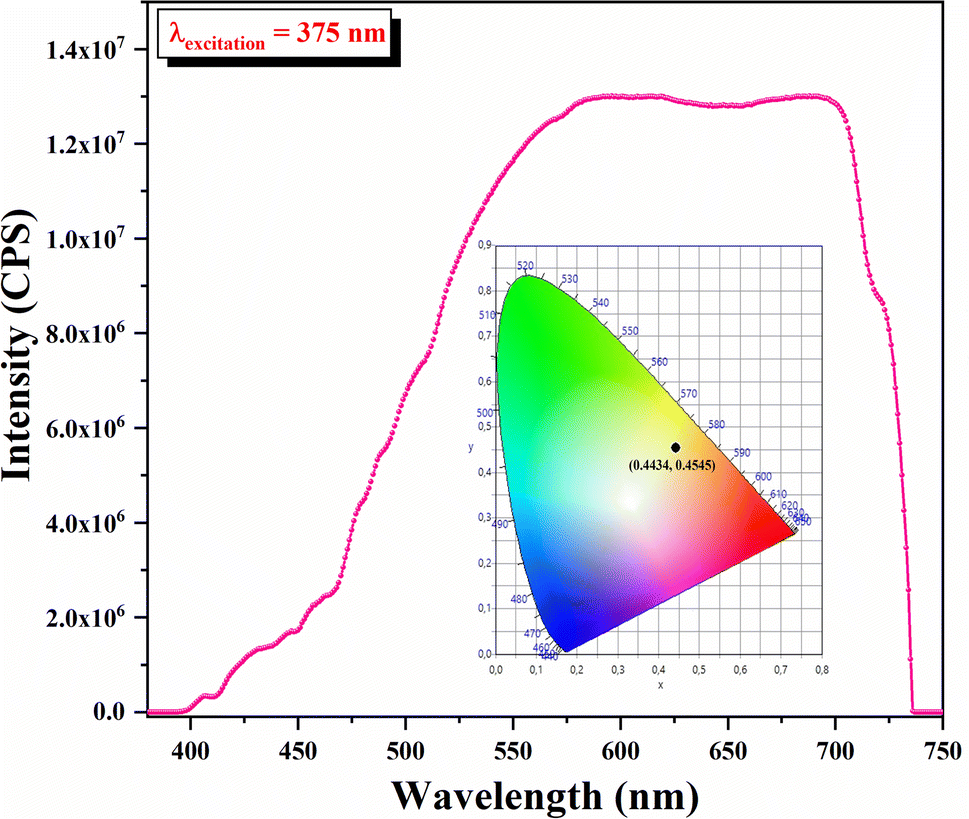 | ||
| Fig. 12 Fluorescence emission spectrum and CIE coordinates of KPbFAp. | ||
As can be inferred from Fig. 12, the chromaticity coordinates were (0.4434, 0.4545). This result constitutes a region covering partially the equienergy point of white light (0.33, 0.33) in the CIE chromaticity diagram.
The first essential step in all fluorescence emission resides in absorption. From this perspective, measuring the pl transition energies can corroborate the presence of excitons in the apatitic matrix. This grants it the ability to be an effective pl emitter, as interaction with light can be invested for detection in multiple light-sensor-based applications. Solid sensors based on ultraviolet light detection can rely on fluoroapatite, since its emission in the visible range with a special colour (orange) can be regarded as an advantage.
Conclusions
This paper introduced a study on the structural, electrical, and optical properties of a new lead fluorapatite compound, Pb5.09Ca3.78K1.13(PO4)6F0.87. The single-crystal XRD study demonstrated that potassium and/or lead ions occupy preferentially the (6h) sites, calcium and/or lead occupy preferentially (4f) sites, and this structure is a partially anionic lacunary apatite stabilized by fluorine. The powder XRD pattern revealed well-resolved and intense peaks, while broad diffused scattering and less intense peaks were observed, indicating a good crystallinity of the sample. The electrical conductivity was assumed to refer to K(6h) mobility in the tunnel. FTIR spectroscopy detected four distinct bands pertaining to the tetrahedral phosphate group. According to the analysis of the complex impedance spectra, the investigated apatite was proved to behave like a semiconductor owing to the fact that its electrical conductivity was thermally activated. The spatial tunnels of the apatitic structure around the c axis promoted anion diffusion, resulting in a high ionic conductivity along this axis. The optical properties of the material were thoroughly investigated, showcasing UV-vis absorption. The estimated band gap of 3.65 eV further underscores the material's potential. The fluorescence spectrum exhibited emissions in the orange region when excited at 375 nm. As a final note, it is noteworthy that this fluoroapatite can be regarded as a promising candidate for solid-sensor applications based on the detection of ultraviolet light and its emission in the visible range with a special orange colour, which can appear as a beneficial feature. This research work is valuable in terms of offering promising future directions. In subsequent work, we intend to investigate the conduction in the matrix of fully lacunar apatites relative to non-lacunar or partially lacunar apatites.Author contributions
Writing – original draft: M. H., B. H.; conceptualization: A. B. H., H. E. F., M. H., F. C.; data curation: B. H., M. H.; investigation: A. B. H., H. E. F., M. H., F. C.; visualization: A. B. H., F. C., B. H; project administration: H. E. F., F. C.; B. H.; supervision: H. E. F., B. H., F. C.; writing – review & editing: M. H., B. H., F. C. All authors have read and agreed to the published version of the manuscript.Conflicts of interest
There are no conflicts to declare.Acknowledgements
Authors thank the anonymous reviewers for their accurate and precious revision work of the whole manuscript. F. C. is grateful to Antonello Ranieri and Francesco Baldassarre (Institute of Crystallography—CNR) for their helpful discussion on XRD measurements.References
- M. Rossi, M. R. Ghiara, G. Chita and F. Capitelli, Am. Mineral., 2011, 96, 1828–1837 CrossRef CAS.
- N. Ramesh, S. C. Moratti and G. J. Dias, J. Biomed. Mater. Res., 2018, 106, 2046–2057 CrossRef CAS PubMed.
- H. El Feki, J. M. Savariault and A. Ben Salah, J. Alloys Compd., 1999, 287, 114–120 CrossRef CAS.
- Y. Ben Salah, H. Oudadesse, B. Lefeuvre, S. Tounsi and H. El Feki, Int. J. Environ. Sci. Technol., 2022, 1–12 Search PubMed.
- S. Jebahi, R. Nsiri, M. Boujbiha, E. Bouroga, T. Rebai, H. Keskes, A. El Feki, H. Oudadesse and H. El Feki, Eur. J. Orthop. Surg. Traumatol., 2013, 23, 759–766 CrossRef PubMed.
- S. Boulila, A. El Feki, H. Oudadesse and H. El Feki, Toxicol. Mech. Methods, 2015, 25, 155–165 CrossRef CAS PubMed.
- F. Baldassarre, A. Altomare, N. Corriero, E. Mesto, M. Lacalamita, G. Bruno, A. Sacchetti, B. Dida, D. Karaj, G. Della Ventura, F. Capitelli and D. Siliqi, Crystals, 2020, 10, 250 CrossRef CAS.
- K. Nie, X. Ma, P. Lin, N. Kumar, L. Wang and L. Mei, J. Rare Earths, 2021, 39, 1320–1326 CrossRef CAS.
- J. Oliva, J. De Pablo, J. L. Cortina, J. Cama and C. Ayora, J. Hazard. Mater., 2010, 184, 364–374 CrossRef CAS PubMed.
- F. Capitelli, B. Dida, G. Della Ventura, F. Baldassarre, D. Capelli, G. S. Senesi, A. Mele and D. Siliqi, Proceedings, 2021, 62, 11 Search PubMed.
- B. Hamdi, J. M. Savariault, H. El Feki and A. Ben Salah, Acta Crystallogr. C, 2004, 60, i1–i2 CrossRef PubMed.
- B. Hamdi, H. El Feki, A. Ben Salah, P. Salles, P. Baules and J. M. Savariault, Solid State Ionics, 2006, 177, 1413–1420 CrossRef CAS.
- F. Baldassarre, A. Altomare, E. Mesto, M. Lacalamita, B. Dida, A. Mele, E. M. Bauer, M. Puzone, E. Tempesta and F. Capitelli, Crystals, 2023, 13, 117 CrossRef CAS.
- B. Hamdi, H. Feki, J. M. Savariault and A. Ben Salah, Mater. Res. Bull., 2007, 42, 299–311 CrossRef CAS.
- R. Cancelliere, G. Rea, L. Micheli, P. Mantegazza, E. M. Bauer, A. El Khouri, A. Altomare, D. Capelli and F. Capitelli, Materials, 2023, 16, 4522 CrossRef CAS PubMed.
- P. E. Mackie, J. C. Elliot and R. A. Young, Acta Crystallogr. B, 1972, 28, 1840–1848 CrossRef CAS.
- T. J. White and Z. Dong, Acta Crystallogr. B, 2003, 59, 1–16 CrossRef CAS PubMed.
- M. Takahashi, K. Uematsu, Z. G. Ye and M. Sato, J. Solid State Chem., 1998, 139, 304–309 CrossRef CAS.
- M. E. Fleet and X. Liu, J. Solid State Chem., 2005, 178, 3275–3283 CrossRef CAS.
- T. Nakajima, K. Nishio, T. Ishigaki and T. Tsuchiya, J. Sol-Gel Sci. Technol., 2005, 33, 107–111 CrossRef.
- A. Piotrowski, V. Kahlenberg and R. X. Fischer, Eur. J. Mineral., 2004, 16, 279–284 CrossRef CAS.
- N. V. Bulina, M. V. Chaikina, I. Y. Prosanov, D. V. Dudina and L. A. Solovyov, J. Solid State Chem., 2017, 252, 93–99 CrossRef CAS.
- N. Arnich, M. C. Lanhers, F. Laurensot, R. Podor, A. Montiel and D. Burnel, Environ. Pollut., 2003, 124, 139–149 CrossRef CAS PubMed.
- N. L. Ignjatović, R. Janković, V. Uskoković and D. P. Uskoković, Toxicol. Res., 2019, 8, 287–296 CrossRef PubMed.
- M. Kwaśniak-Kominek, J. Matusik, T. Bajda, M. Manecki, J. Rakovan, T. Marchlewski and B. Szala, Polyhedron, 2015, 99, 103–111 CrossRef.
- I. Mayer, S. Cohen and J. R. Matalon, J. Solid State Chem., 1981, 36, 271–274 CrossRef CAS.
- M. El Koumiri, S. Oishi, S. Sato, L. El Ammari and B. Elouadi, Mater. Res. Bull., 2000, 35, 503–513 CrossRef CAS.
- R. Ternane, M. Ferid, M. Trabelsi-Ayedi and B. Piriou, Spectrochim. Acta, Part A, 1999, 55, 1793–1797 CrossRef.
- A. Laghzizil, P. Barboux and A. Bouhaouss, Solid State Ionics, 2000, 128, 177–181 CrossRef CAS.
- A. Piotrowski, V. Kahlenberg and R. X. Fischer, J. Solid State Chem., 2002, 163, 398–405 CrossRef CAS.
- A. Laghzizil, A. Bouhaouss, M. Ferhat, P. Barboux, R. Morineau and J. Livage, Adv. Mater. Res., 1994, 1, 479–488 Search PubMed.
- Q. Yan, Y. Zhu, G. Feng, Z. Zhu, L. Zhang, J. Liu and H. He, Appl. Geochem., 2020, 120, 104659 CrossRef CAS.
- A. Laghzizil, S. El Hajjaji, A. Bouhaouss and M. Ferhat, Solid State Ionics, 1999, 126, 245–250 CrossRef CAS.
- A. Laghzizil, N. El Herch, A. Bouhaouss, G. Lorente and J. Macquete, J. Solid State Chem., 2001, 156, 57–60 CrossRef CAS.
- A. Gee and V. R. Deitz, Anal. Chem., 1953, 25, 1320–1324 CrossRef CAS.
- G. M. Sheldrick, SHELXS-97, Program for the Solution of Crystal Structures, University of Göttingen, Göttingen (Germany), 1997 Search PubMed.
- G. M. Sheldrick, Acta Crystallogr. C, 2015, 71, 3–8 CrossRef PubMed.
- CrystalMaker Software, CrystalMaker. Version 4.4, CrystalMaker Software, Bicester, England, 1999 Search PubMed.
- G. Bergerhoff, M. Berndt and K. Brandenburg, J. Res. Natl. Inst. Stand. Technol., 1996, 101, 221 CrossRef CAS PubMed.
- J. Rodríguez-Carvajal, Phys. B, 1993, 192, 55–69 CrossRef.
- S. K. Wolff, D. J. Grimwood, J. J. McKinnon, M. J. Turner, D. Jayatilaka and M. A. Spackman, Crystal Explorer (Version 3.1), University of Western Australia, 2012 Search PubMed.
- M. A. Spackman and D. Jayatilaka, CrystEngComm, 2009, 11, 19–32 RSC.
- M. Wei, J. H. Evans, T. Bostrom and L. Grøndahl, J. Mater. Sci.: Mater. Med., 2003, 14, 311–320 CrossRef CAS PubMed.
- A. Traveriai Cros, M. Á. Cuevas Diarte, F. Plana Llevat and M. Font-Altaba, Acta Geol. Hisp., 1980, 15, 15–17 Search PubMed.
- R. M. Wilson, J. C. Elliott and S. E. P. Dowker, Am. Mineral., 1999, 84, 1406–1414 CrossRef CAS.
- O. Ursini, E. Lilla and R. Montanari, J. Hazard. Mater., 2006, 137, 1079–1088 CrossRef CAS PubMed.
- M. Mathew, W. E. Brown, M. Austin and T. Negas, J. Solid State Chem., 1980, 35, 69–76 CrossRef CAS.
- E. L. Belokoneva, E. A. Troneva, L. N. Demyanets, N. G. Duderov and N. V. Belov, Kristallografiya, 1982, 27, 793–794 CAS.
- V. M. Bhatnagar, Mater. Res. Bull., 1971, 6, 1–3 CrossRef CAS.
- N. Leroy, E. Bres, D. B. Jones and S. Downes, Eur. Cells Mater., 2001, 30, 36–48 CrossRef PubMed.
- A. P. Soroka, V. L. Karbovskiy and V. H. Kasianenko, Funct. Mater., 2015, 22, 79–92 CrossRef CAS.
- J. Y. Kim, R. R. Fenton, B. A. Hunter and B. J. Kennedy, Aust. J. Chem., 2000, 53, 679–686 CrossRef CAS.
- T. Naddari, J. M. Savariault, H. El Feki, P. Salles and A. B. Salah, J. Solid State Chem., 2002, 166, 237–244 CrossRef CAS.
- F. Capitelli, R. Khaoulaf, M. Harcharras, A. Ennaciri, S. H. Habyby, V. Valentini, G. Mattei and V. Bertolasi, Z. Kristallogr. – Cryst. Mater., 2005, 220, 25–30 CrossRef CAS.
- F. Capitelli, K. Brouzi, M. Harcharras, A. Ennaciri, A. G. Moliterni, V. Bertolasi and Z. Kristallogr, Cryst. Mater., 2004, 219, 93–98 CAS.
- S. Nakayama, Y. Higuchi, Y. Kondo and M. Sakamoto, Solid State Ionics, 2004, 170, 219–223 CrossRef CAS.
- Y. Higuchi, M. Sugawara, K. Onishi, M. Sakamoto and S. Nakayama, Ceram. Int., 2010, 36, 955–959 CrossRef CAS.
- K. Boughzala and K. Bouzouita, C. R. Chim., 2015, 18, 858–866 CrossRef CAS.
- S. B. Moussa, M. Laajimi, R. B. Chaâbane, B. Badraoui, M. Gruselle and A. Laghzizil, J. Mol. Struct., 2017, 1147, 114–120 CrossRef.
- D. Marrero-López, M. C. Martín-Sedeño, J. Peña-Martínez, J. C. Ruiz-Morales, P. Núñez, M. A. G. Aranda and J. R. Ramos-Barrado, J. Power Sources, 2010, 195, 2496–2506 CrossRef.
- M. Bembli, R. Khiari, M. Hidouri and K. Boughzala, Chem. Afr., 2024, 1–18 Search PubMed.
- M. Hidouri, Mater. Chem. Phys., 2019, 228, 254–262 CrossRef CAS.
- K. Kthiri, M. Mehnaoui, S. Jebahi, K. Boughzala and M. Hidouri, Mineralogy, 2022, 33, 125 Search PubMed.
- K. Kthiri, M. Mehnaoui, K. Boughzala and M. Hidouri, Appl. Phys. A, 2022, 128, 678 CrossRef CAS.
- M. Resano, E. Bolea-Fernandez, E. Mozas, M. Florez, P. Grinbergc and R. E. Sturgeonc, J. Anal. At. Spectrom., 2013, 28, 657–665 RSC.
- H. K. Liu, L. B. Liao, Y. Y. Zhang, S. M. Aksenov, N. Liu, Q. F. Guo, D. V. Deyneko, T. Y. Wang, L. F. Mei and C. H. Sun, Rare Met., 2021, 40, 3694–3700 CrossRef CAS.
Footnote |
| † CCDC 2322143. For crystallographic data in CIF or other electronic format see DOI: https://doi.org/10.1039/d4ra01014k |
| This journal is © The Royal Society of Chemistry 2024 |