 Open Access Article
Creative Commons Attribution 3.0 Unported Licence
Impact of SiO2 doping on the structure and oil–water separation properties of a PVDF membrane: insights from molecular dynamics simulation
Yi Liu ab,
Jing Zhangab,
Jiale Liab,
Yuxing Zhaoab and
Ming Zhang*ab
aSchool of Chemistry and Chemical Engineering, Tianjin University of Technology, Tianjin 300384, China. E-mail: zm2404@tjut.edu.cn
bCenter of Membrane Materials and Engineering Technology, Tianjin University of Technology, Tianjin 300384, China
First published on 31st July 2024
Abstract
Hybrid inorganic particles combined with polymers are widely used to modify the properties of polymer membranes. However, the mechanism by which particles affect membranes remains unclear. This study investigates SiO2-hybridized PVDF membranes through molecular dynamic simulation, focusing on the interaction between SiO2 clusters and PVDF chains. It examines the impact of varying SiO2 concentrations (3.5 wt%, 6.8 wt%, 9.9 wt%, 12.8 wt%, and 15.5 wt%) on membrane stability and structure. The results indicate that adding SiO2 can inhibit PVDF chain mobility in the membrane with minimal effect on fractional free volume (FFV), except for altering interactions between PVDF–PVDF, PVDF–SiO2, and SiO2–SiO2, thereby affecting the structure of hybrid membranes. The adsorption and diffusion behavior of water and oil molecules on these membranes were also studied. It was observed that the adsorption energy and diffusion coefficient initially increase and then decrease with increasing SiO2 concentration, reaching an optimum between 6.8 wt% and 12.8 wt%. This phenomenon is attributed to the ability of optimal SiO2 concentrations to create hydrophilic channels in PVDF membranes, enhancing water affinity and reducing oil affinity. Consequently, water permeation through the hybrid membrane is promoted, improving the efficiency of oil/water separation compared to pure PVDF membranes. This research contributes to understanding the function of adding inorganic particles to polymer membranes and provides insights for designing advanced functional hybrid membranes.
1 Introduction
With the increasing demand for industrial production, the generation of numerous oily wastewaters has caused significant damage to the environment and human health. Consequently, addressing the challenge of water pollution through effective oil–water separation has become imperative. Common methods for separating oil–water mixtures include centrifugation,1,2 adsorption purification,3,4 membrane separation,5,6 and others. Among these, membrane separation technology has garnered considerable attention due to its advantages of low energy consumption, simple operation, strong selectivity, environmental friendliness, and high separation accuracy.7 Polymer membranes, notably polyvinylidene fluoride (PVDF),8–10 polyether sulfone (PES)11–13 and polypropylene (PP)14–16 are widely utilized in practical applications.The PVDF membrane, in particular, has emerged as the most extensively employed membrane owing to its commendable mechanical properties, ease of cleaning, and reusability.17 It has been selected as an efficient liquid separation membrane for emulsified water-in-oil/oil-in-water solutions in many studies. Hai's lab18 has prepared a superhydrophobic and superoleophilic PVDF membrane using the phase inversion method, achieving a high flux of 8800 L m−2 h−1. Nie and coworkers19 employed a simple one-step method to achieve hydrophilic modification of electrospun PVDF nanofiber membranes for oil–water separation, consistently achieving separation efficiencies exceeding 99.50%.
To enhance membrane performance, particularly its anti-fouling properties,20 various methods have been adopted, such as surfactant modification,21,22 grafting,23,24 blending25,26 and loading nanoparticles onto the membrane. Common inorganic particles suitable for hybridization with PVDF membranes include TiO2,27–29 Al2O3,30–32 and SiO2.33–35 Among these, SiO2 stands out as the most widely used due to its mild reactivity and well-known chemical properties. Xu et al. 36 developed a superhydrophilic tea polyphenols/silica composite coating, resulting in an ultrahigh water flux of 15![[thin space (1/6-em)]](https://www.rsc.org/images/entities/char_2009.gif) 353 L m−2 h−1. Additionally, the modified membrane achieved highly efficient separation of oil/water emulsions (above 96%). Xu's lab37 prepared a superhydrophobic/superoleophilic SiO2/PVDF membrane, exhibiting stable fluxes for petroleum ether/water, n-hexane/water, and n-heptane/water at 3886 ± 140, 3551 ± 146, and 3763 ± 57 L m−2 h−1, respectively, with separation efficiencies consistently above 99.7%. Wen et al. 38 prepared cotton fiber@SiO2 superhydrophobic fabric can be used for the separation of oil/water mixtures with a separation efficiency of 98%.
353 L m−2 h−1. Additionally, the modified membrane achieved highly efficient separation of oil/water emulsions (above 96%). Xu's lab37 prepared a superhydrophobic/superoleophilic SiO2/PVDF membrane, exhibiting stable fluxes for petroleum ether/water, n-hexane/water, and n-heptane/water at 3886 ± 140, 3551 ± 146, and 3763 ± 57 L m−2 h−1, respectively, with separation efficiencies consistently above 99.7%. Wen et al. 38 prepared cotton fiber@SiO2 superhydrophobic fabric can be used for the separation of oil/water mixtures with a separation efficiency of 98%.
The particles can obviously improve the performance of the PVDF membrane; however, the interaction among the particles, polymer membrane, and oil/water molecules is still not clear. To unravel the effect of nanoparticle on the membrane properties, some simulation works have been adopted. Liang et al.39 designed three kinds of modified SiO2 nanoparticles grafted with hydrophilic chains, hydrophobic chains, and mixed hydrophilic and hydrophobic chains to detach adsorbed oil droplet on silica surface. Similarly, Bai's lab40 investigated the effects of the size of silica particles on the diffusion behavior of water in SiO2/PVDF hybrid membranes. Even though more simulation work41–43 has been done, the interaction mechanism between particles and membrane, as well as the surface interaction between oil/water and hybrid membrane, is still not clear. Furthermore, how the nanoparticles affect the separation of oil–water emulations remains uncertain.
In this study, a model of a SiO2/PVDF hybrid membrane with various oil and water molecules was constructed. The aggregation of SiO2 nanoclusters with different concentrations in the PVDF membrane was investigated, and the interaction among SiO2, PVDF, and oil/water molecules was analyzed. Based on the analysis of the interaction, the effect of SiO2 on the structure of PVDF membranes and separation performance for oil–water emulation were studied. This study unveils the adsorption and diffusion mechanisms of oil and water with SiO2/PVDF hybrid membrane at the molecular level, providing a theoretical foundation for the design and development of high-performance oil/water separation membranes.
2 Model and methodology
2.1. Models and molecules
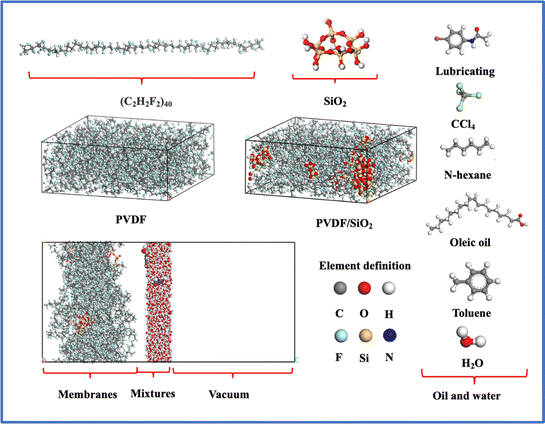
The MD simulations were carried out using Materials Studio 7.0 software,44 the SiO2 clusters was built as follows: initially, the α-SiO2_quartz was imported, then a spherical shape was chosen, and the radius was set to 3 Å using the Build Nanocluster function. The resulting SiO2 clusters were then saturated with hydrogen. Next, hydrogen atoms directly connected to the Si atoms were screened out and replaced with oxygen atoms. Finally, the atoms were hydrogen saturated again.45 The purpose of this process is to ensure that the oxygen atoms directly connected to the Si atoms are bonded and saturated, and to protonate them to form Si–OH groups, thus avoiding subsequent bonding deficiencies that could result in unsuccessful model optimization.The PVDF single chain, consisting of 40 difluoroethylene repeating units, was constructed using the Forcite module.46 SiO2 clusters were then randomly distributed within the PVDF membrane to form a hybrid SiO2/PVDF model. The concentration of SiO2 varied from 3.5 wt% to 15.5 wt%, while the initial density of the PVDF membrane was set to 1.7 g cm−3. The box length along the a and b directions was fixed at 50 Å.
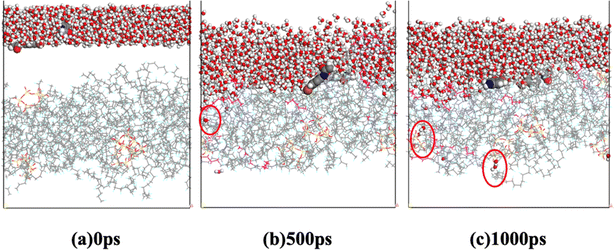
The oil–water mixture was placed on the surface of SiO2/PVDF. Carbon tetrachloride, n-hexane, toluene, oleic acid, and lubricating oil were chosen as representatives of oil-in-water emulsions based on their molecular weights and different functional groups. The density of the oil–water mixing layer is 1 × 10³ kg m−3, and the molar ratio content of oil in oil-in-water emulsions is approximately 3 wt% ± 0.5. The effect of periodic boundaries on the adsorption results is eliminated by creating a vacuum layer with a thickness of about 50 Å on the membrane layer. The models used in this work were shown in Fig. 1.
2.2. Simulation details
The Anderson thermostat and barostat52 were used to maintain the temperature and pressure for all dynamic simulations. A group-based cut-off distance of 12.5 Å was used to avoid interactions between the non-bonded van der Waals and electrostatic forces. The long-range electrostatic interactions were evaluated by the Ewald summation method. The coordinates of the system were collected every 10![[thin space (1/6-em)]](https://www.rsc.org/images/entities/char_2009.gif) 000 steps. Trajectory frames were captured during the production run and the data from the final 1000 ps was used for analysis. The well-validated COMPASS force field was selected for all MD simulations because it has been widely used for accurate prediction of the structural and thermophysical properties of polymer molecules under various conditions.
000 steps. Trajectory frames were captured during the production run and the data from the final 1000 ps was used for analysis. The well-validated COMPASS force field was selected for all MD simulations because it has been widely used for accurate prediction of the structural and thermophysical properties of polymer molecules under various conditions.
| MSD(t) = 〈|ri(t) − ri(0)|2〉 | (1) |
 | (2) |
| D = 〈MSD〉/(6t) | (3) |
Diffusion coefficient D is a physical quantity that expresses the diffusion speed of atoms, and it is a simple method to analyze the diffusion behavior of atoms in the membrane from a microscopic point of view through molecular simulation, and the diffusion coefficient D can be obtained by the calculation of eqn (2), and the relationship between MSD and diffusion coefficient D in the MS calculation is shown in eqn (3).
 | (4) |
Furthermore, the ratio of large and small holes of various diameters is derived through the subsequent formula:
 | (5) |
| Eads = −(Etotal − Emembrane − Esmall) | (6) |
3 Results and discussion
3.1. The influence of SiO2 on the stability of the PVDF membrane
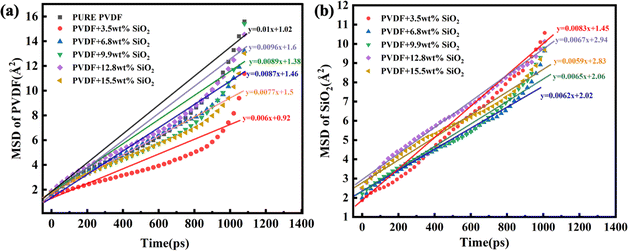
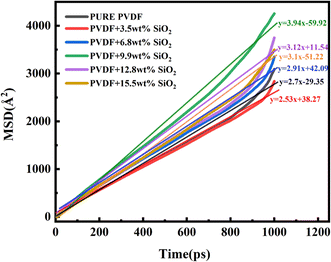
The MSD values of PVDF molecules in membranes with and without SiO2 are shown in Fig. 2a. It is evident that the slope of the curve for the pure PVDF membrane is 0.01. As SiO2 nanoparticle doping increases, the slope value exhibits a slight decrease from 0.01 with 0 wt% addition of SiO2 to 0.006 with 3.5 wt% addition, followed by an increase with further SiO2 addition, reaching 0.0087 at 6.8% and 0.0089 at 9.9 wt%. Subsequently, the slope decreases again to 0.0077 with 15.5 wt% SiO2 addition. Notably, the slope value for the 9.9 wt% SiO2 addition is 0.0089, which closely resembles that of the pure PVDF membrane.
These results indicate that the addition of SiO2 can inhibit the mobility of PVDF chains in the membranes. The slope of the pure PVDF membrane is highest at 0.01. At low concentrations of SiO2, the slight decrease can be attributed to the distribution of SiO2 among PVDF chains. The binding interaction between SiO2 clusters and chains decreases the mobility of PVDF. However, with increasing SiO2 addition, the SiO2 tends to aggregate in the membrane, weakening the interaction between SiO2 and PVDF. Consequently, the mobility of PVDF exhibits a slight increase. With further SiO2 addition, the SiO2 clusters occupy more space, pushing the PVDF chains closer together, leading to a notable decrease in PVDF mobility at 15.5 wt% addition, reaching 0.0077.
The aggregation of SiO2 clusters with various additions in the membrane has been analyzed using the MSD of SiO2, as shown in Fig. 2b. It is clear that with the increase in SiO2, the slope of the curve exhibits an obvious decrease. The slope for 3.5 wt% SiO2 is 0.0083, but for the 9.9 wt% addition of SiO2, it decreases to 0.0065. With the concentration of SiO2 increasing to 15.5 wt%, it further decreases to 0.0059. This indicates that the movement of SiO2 clusters weakens with the increasing addition of SiO2 in the membrane.
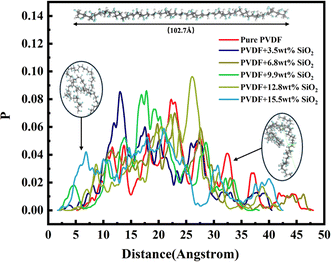
The aggregation of SiO2 at various concentrations in the hybrid membrane is also illustrated in Fig. 3. As depicted in the top and side views in Fig. 3a and b, it is evident that with the addition of 3.5 wt%, the four SiO2 clusters were uniformly deposited within the membrane. However, with an increase in SiO2 concentration, slight aggregation of clusters is observed at 6.8 wt% and 9.9 wt%. Moreover, with further increases in SiO2 concentration to 12.8 wt% and 15.5 wt%, larger aggregations appear in the membrane. The distribution of SiO2 clusters with different concentrations along the Z-axis in the membrane is also shown in Fig. 3c, where each color curve represents a different SiO2 cluster in the membrane. It is observed that the peaks exhibit increasing overlap with higher concentrations of SiO2, particularly at 12.8 wt% and 15.5 wt%, indicating that the different SiO2 clusters aggregate at higher concentrations. This observation is consistent with the MSD curves of PVDF chains in the hybrid membranes as depicted in Fig. 2.
Eqn (7) is represented as:
 | (7) |
Eqn (8) is represented as:
 | (8) |
Eqn (9) is represented as:
 | (9) |
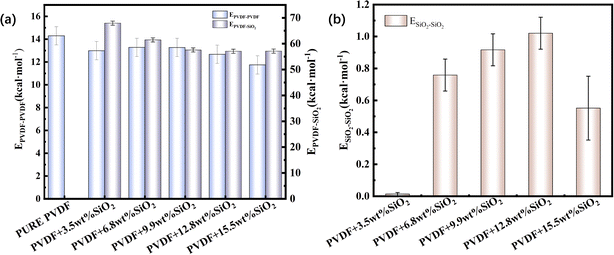
The three kinds of interaction within the hybrid membrane were depicted in Fig. 4. As shown in Fig. 4a, it is evident that the interaction between PVDF chains in the pure PVDF membrane is highest, at 14.3 kcal mol−1. With the increasing concentration of SiO2, the EPVDF–PVDF exhibits a slight decrease to 13.0 kcal mol−1 for 3.5 wt%, then increases again to 13.3 kcal mol−1 for 6.8 wt% and 13.4 kcal mol−1 for 9.9 wt%, subsequently decreasing to 12.7 kcal mol−1 for 12.8 wt% addition of SiO2, and further to 11.7 kcal mol−1 for 15.5 wt% of SiO2. This changing trend suggests that the addition of SiO2 decreases the interaction between PVDF chains. This can be explained by the addition of SiO2 distributing among the PVDF chains, thereby weakening the interaction between PVDF chains, which is also consistence with the mobility of PVDF chain within the membrane as shown in Fig. 2.
The fluctuation of EPVDF–PVDF with various concentration of SiO2 also can be contributed to the distribution and aggregation of SiO2 clusters in the membrane. As shown in Fig. 4b, at an addition concentration of 3.5 wt% SiO2, the interaction between SiO2 clusters is at its lowest, only 0.01 kcal mol−1, because the small amount of SiO2 is distributed far apart from each other, more than 10 Å (as seen in Fig. 2), resulting in almost no interaction between them. With an increase in the concentration of SiO2, the ESiO2–SiO2 exhibits a noticeable increase. For the concentration of 12.8 wt% SiO2, the ESiO2–SiO2 is about 1.0 kcal mol−1, indicating that SiO2 clusters form spurious aggregation. This can also be observed in Fig. 2b.
The aggregation of SiO2 clusters also affects the interaction between PVDF chains and SiO2. As shown in Fig. 4a, the EPVDF–SiO2 exhibits a noticeable decrease from 68.0 kcal mol−1 with a 3.5 wt% concentration of SiO2 to 57.2 kcal mol−1 with a 15.5 wt% concentration of SiO2. This occurs because, for the same number of SiO2 clusters, the aggregation of SiO2 reduces the total contact area between SiO2 clusters and PVDF chains compared to dispersed SiO2.
3.2. Effect of SiO2 on the structure of the PVDF membrane
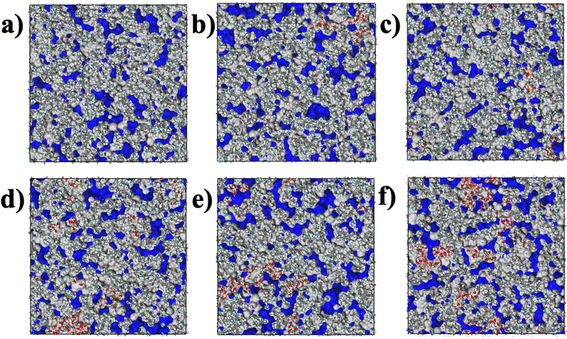
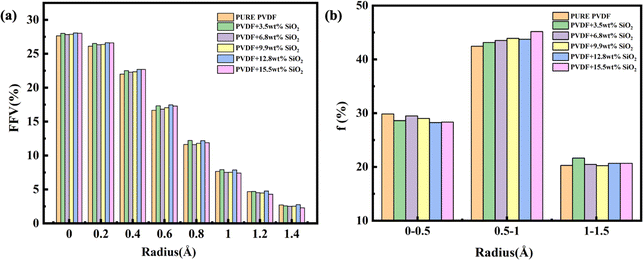
The FFV with different radius probes for various membranes is also presented in Fig. 7. As depicted, the pore distributions are similar, even for pure PVDF membranes or SiO2 hybrid PVDF membranes. Furthermore, it is evident that the overall porosity of all membranes, with or without SiO2, is approximately 28% volume/volume (v/v), with a notably higher proportion of small pores compared to larger ones. For instance, pores under 0.2 Å radius constitute more than 25%, whereas pores over 1.2 Å radius are less than 5%.
Additionally, as illustrated in Fig. 7b, medium-sized pores, ranging between 0.5–1.0 Å (radius), account for 45% of the total pore volume. Pores with a probe radius of 0–0.5 Å constitute less than 30%, while those with a probe radius of 1.0–1.5 Å comprise approximately 20%. This variation in pore size distribution is consistent across various membranes. The pore distribution analysis of membranes with and without SiO2 suggests that the addition of SiO2 has a minimal impact on pore size and distribution within the membrane.
| Membranes | Diffusion coefficient (1 × 10⁻⁶ cm2 s−1) |
|---|---|
| Pure PVDF | 0.45 |
| PVDF + 3.5 wt% SiO2 | 0.42 |
| PVDF + 6.8 wt% SiO2 | 0.49 |
| PVDF + 9.9 wt% SiO2 | 0.66 |
| PVDF + 12.8 wt% SiO2 | 0.52 |
| PVDF + 15.5 wt% SiO2 | 0.51 |
The variation in water diffusion coefficient can be attributed to the mobility of PVDF chains and the hydrophilicity of SiO2 clusters within the membrane. At lower concentrations, such as 3.5 wt%, SiO2 distributes well within the membrane, limiting the mobility of PVDF chains (as shown in Fig. 2). The presence of SiO2 between PVDF chains may obstruct some membrane channels, thereby reducing the formation of diffusion paths and subsequently decreasing the chance of water molecule passage through membrane pores, resulting in a smaller diffusion coefficient. As the SiO2 addition increases, SiO2 clusters can form hydrophilic channels within the membrane. This increase in the membrane's hydrophilicity further promotes the transfer of water molecules within the membrane, with the maximum diffusion reaching 0.66 × 10⁻⁶ cm2 s−1 at 9.9 wt%. However, with further SiO2 increases, SiO2 nanoclusters aggregation exerts a repulsive effect on water transfer, leading to a slight decrease in the diffusion coefficient (D value). These results suggest that the impact of SiO2 addition on water diffusion through the membrane is concentration-dependent. In this study, the optimal formulation is found to be 9.9 wt% addition of SiO2.
3.3. Effect of SiO2 on membrane separation of oil-in-water emulsions
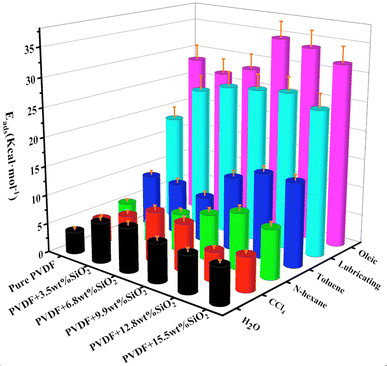
In many works,53,54 the addition of SiO2 has been shown to enhance the separation efficiency of PVDF membranes. However, the impact of SiO2 on the separation mechanism for various oil–water emulsions remains unclear. This section investigates the adsorption of water and typical oils (carbon tetrachloride, lubricating oil, oleic acid, hexane, toluene) on the hybrid membrane, as well as the diffusion of oil–water emulsion through the membrane.The relative adsorption energy of the hybrid membrane for water or oils can influence the separation of oil–water emulsions. The ratio of Eads (water) to Eads (oil) is presented in Table 2. A higher value of Eads (water)/Eads (oil) indicates better adsorption for water and poorer adsorption for oil. As depicted in Table 2, the addition of SiO2 enhances the adsorption of water for all oil–water emulsions. For instance, for the H2O/n-hexane emulsion, the membrane with 3.5 wt% SiO2 demonstrates good performance. Similarly, for the emulsions of H2O/toluene, H2O/lubricating, and H2O/oleic, the membrane with 6.8 wt% SiO2 exhibits better performance. This suggests that for different oil–water emulsions, the optimal hybrid membrane requires varying additions of SiO2 nanoclusters.
| H2O/CCl4 | H2O/n-hexane | H2O/toluene | H2O/lubricating | H2O/oleic | |
|---|---|---|---|---|---|
| Pure PVDF | 0.90 | 0.70 | 0.43 | 0.21 | 0.13 |
| PVDF + 3.5% SiO2 | 1.09 | 2.07 | 0.80 | 0.28 | 0.26 |
| PVDF + 6.8% SiO2 | 0.90 | 1.19 | 1.00 | 0.29 | 0.27 |
| PVDF + 9.9% SiO2 | 0.82 | 0.85 | 0.53 | 0.25 | 0.19 |
| PVDF + 12.8% SiO2 | 1.29 | 0.67 | 0.44 | 0.24 | 0.19 |
| PVDF + 15.5% SiO2 | 1.07 | 0.75 | 0.43 | 0.25 | 0.19 |
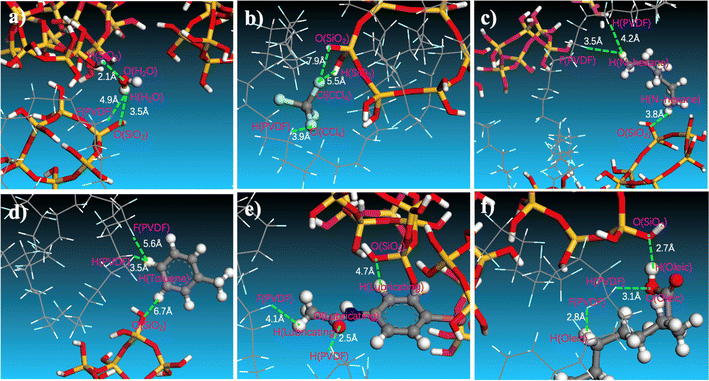
The effect of SiO2 on the separation of oil/water emulsions can be attributed to interactions between oil molecules and the membrane. A typical snapshot in Fig. 10 illustrates the relative positions of water or oil molecules within the SiO2 (9.9 wt%) hybrid PVDF membrane. Specifically, the distance between the hydrogen atom of H2O and the oxygen of hydrated SiO2 is approximately 3.5 Å. In contrast, the distances between the hydrogen atoms of n-hexane (Fig. 10c), toluene (Fig. 10d), and lubricating oil (Fig. 10e) and the oxygen of hydrated SiO2 are elongated to 3.8 Å, 6.7 Å, and 4.7 Å, respectively.
Conversely, the distance between the oxygen atom of H2O and the hydrogen atom of PVDF is 4.9 Å (Fig. 10a), which is greater than the distance between the chlorine atom of CCl4 (Fig. 10b) and the hydrogen atom of PVDF (3.9 Å), as well as the distances between the oxygen atom of lubricating oil (Fig. 10e) and the hydrogen atom of PVDF (2.5 Å), and between the oxygen atom of oleic acid (Fig. 10f) and the hydrogen atom of PVDF (3.1 Å). These indicate that oil molecules have a certain affinity with the pure PVDF chain. However, the addition of SiO2 increases the membrane's affinity for water and reduces its affinity for oils. This enhancement promotes water permeation through the membrane and improves the efficiency of oil/water separation in PVDF membranes.
4 Conclusion
This study investigated the impact of SiO2 on PVDF membrane structure and performance through molecular dynamic simulation. Results indicate SiO2 addition initially increases then decreases motility and interaction energy of PVDF chains, affecting membrane structure. Low concentration SiO2 addition weakens PVDF chain interaction, enhancing chain mobility. While pore size is minimally affected by hybridization, diffusion coefficient slightly increases with 9.9 wt% SiO2. SiO2 incorporation significantly influences adsorption diffusion of oil and water molecules, with aggregation affecting diffusion patterns. Variations in SiO2 concentration show different effects on oil–water emulsion separation, aiding high-performance membrane design. Overall, the study offers insights into nanoparticle–polymer chain interaction for membrane optimization in oil–water separation applications.Data availability
Correspondence and requests for materials and data should be addressed to Ming Zhang.Author contributions
Yi Liu developed the concept, collected information, designed and executed the simulations, analyzed the data, and wrote the manuscript. Jing Zhang and Jiale Li assisted in simulations and conducted data analysis. Yuxing Zhao conducted preliminary simulations during the concept development stage. Ming Zhang supervised the research, revised the manuscript, and discussed the results.Conflicts of interest
The authors declare no competing financial interests.Acknowledgements
This work was supported by Graduate Student Research and Innovation Practice Program of Tianjin University of Technology (No. YJ2256). We also acknowledge National Supercomputing Center in Shenzhen for providing the computational resources and Materials Studio 7.0.References
- K. T. Klasson, P. A. Taylor, J. F. Walker, S. A. Jones, R. L. Cummins and S. A. Richardson, Sep. Sci. Technol., 2005, 40, 453–462 CrossRef CAS.
- J. Qu, J. F. Mukerabigwi, N. Yang, X. Huang, Y. Sun, X. Cai and Y. Cao, Appl. Nanosci., 2021, 11, 257–266 CrossRef CAS.
- Y. Wang, M. Peng, A. Kong, L. Yang, J. Zhang, J. Xia and W. Li, J. Environ. Chem. Eng., 2023, 11, 110247 CrossRef CAS.
- J. Xie, J. Zhang, X. Zhang, Z. Guo and Y. Hu, Res. Chem. Intermed., 2020, 46, 4297–4309 CrossRef CAS.
- A. Karunanithi, J. De, S. Saxena and S. Shukla, Water, Air, Soil Pollut., 2022, 233, 30 CrossRef CAS.
- N. Zhang, X. Yang, Y. Wang, Y. Qi, Y. Zhang, J. Luo, P. Cui and W. Jiang, J. Environ. Chem. Eng., 2022, 10, 107257 CrossRef CAS.
- I. Salahshoori, A. Hatami and A. Seyfaee, J. Iran. Chem. Soc., 2021, 18, 87–107 CrossRef CAS.
- Y. Zhang, X. Duan, B. Tan, Y. Jiang, Y. Wang and T. Qi, Colloids Surf., A, 2022, 644, 128844 CrossRef CAS.
- M. Darvishi and M. Foroutan, RSC Adv., 2016, 6, 74124–74134 RSC.
- C. Xu, F. Yan, M. Wang, H. Yan, Z. Cui, J. Li and B. He, J. Membr. Sci., 2020, 602, 117974 CrossRef CAS.
- F. Gholami, S. Zinadini and A. A. Zinatizadeh, J. Environ. Chem. Eng., 2020, 8, 104482 CrossRef CAS.
- E. S. Mansor, E. A. Ali and A. M. Shaban, Chem. Eng. J., 2021, 407, 127175 CrossRef CAS.
- A. A. R. Abdel-Aty, R. M. G. Ahmed, I. M. A. ElSherbiny, S. Panglisch, M. Ulbricht and A. S. G. Khalil, Sep. Purif. Technol., 2023, 311, 123286 CrossRef CAS.
- Y. Wang, M. Peng, A. Kong, L. Yang, J. Zhang, J. Xia and W. Li, J. Environ. Chem. Eng., 2023, 11, 110247 CrossRef CAS.
- H. Wang, X. Guo, C. Pei, W. Dong and Y. Yao, Polym. Eng. Sci., 2022, 62, 2131–2142 CrossRef CAS.
- M. Gryta, J. Membr. Sci., 2021, 628, 119265 CrossRef CAS.
- I. Salahshoori, A. Mohseni, M. Namayandeh Jorabchi, S. Ghasemi, M. Afshar and S. Wohlrab, J. Mol. Liq., 2023, 375, 121286 CrossRef CAS.
- A. Hai, A. A. Durrani, M. Selvaraj, F. Banat and M. A. Haija, Sep. Purif. Technol., 2019, 212, 388–395 CrossRef CAS.
- Y. Nie, S. Zhang, Y. He, L. Zhang, Y. Wang, S. Li and N. Wang, New J. Chem., 2022, 46, 4734–4745 RSC.
- Y. Ma and J. W. Chew, J. Membr. Sci., 2022, 661, 120874 CrossRef CAS.
- W. Liu, X. Huang, K. Peng, Y. Xiong, J. Zhang, L. Lu, J. Liu and S. Li, Surf. Coat. Technol., 2021, 406, 126743 CrossRef CAS.
- X.-D. Yang, W. Chen, Y. Ren and L.-Y. Chu, Langmuir, 2022, 38, 1277–1286 CrossRef CAS PubMed.
- Z.-Y. Liu, Q. Jiang, Z. Jin, Z. Sun, W. Ma and Y. Wang, ACS Appl. Mater. Interfaces, 2019, 11, 14408–14417 CrossRef CAS PubMed.
- Z. Liu, Master's thesis, Tianjin University of Technology, 2022.
- I. Salahshoori, I. Cacciotti, A. Seyfaee and A. Babapoor, J. Polym. Res., 2021, 28, 223 CrossRef CAS.
- X. S. Yuan, W. Liu, W. Y. Zhu and X. X. Zhu, ACS Omega, 2020, 5, 30201–30209 CrossRef CAS PubMed.
- M. Saleem, M. D. Albaqami, A. A. A. Bahajjaj, F. Ahmed, E. Din, W. U. Arifeen and S. Ali, Molecules, 2023, 28, 285 CrossRef CAS PubMed.
- X. Cao, J. Ma, X. Shi and Z. Ren, Appl. Surf. Sci., 2006, 253, 2003–2010 CrossRef CAS.
- D. Zou, H. W. Kim, S. M. Jeon and Y. M. Lee, J. Membr. Sci., 2022, 652, 120470 CrossRef CAS.
- X. Guo, H. Wang, C. Wu and R. Tian, Int. J. Heat Mass Transfer, 2023, 202, 123739 CrossRef CAS.
- L. Yan, Y. S. Li and C. B. Xiang, Polymer, 2005, 46, 7701–7706 CrossRef CAS.
- H. Zeng, X. Cheng, C. Zhang and Z. Lu, J. Phys. Chem. C, 2018, 122, 9191–9197 CrossRef CAS.
- Q. Liu, X. Zhang, Q. Zhang, T. Wang and B. Jiang, Colloids Surf., A, 2022, 653, 130020 CrossRef CAS.
- I. Salahshoori, A. Seyfaee, A. Babapoor, F. Neville and R. Moreno-Atanasio, J. Mol. Liq., 2021, 333, 115957 CrossRef CAS.
- W. Ren, J. Pan, W. Gai, X. Pan, H. Chen, J. Li and L. Huang, Sep. Purif. Technol., 2023, 311, 123228 CrossRef CAS.
- Q. Xu, X. Ji, J. Tian, X. Jin and L. Wu, Polymers, 2021, 13, 4186 CrossRef CAS PubMed.
- Y. Xu, Y. Yu, C. Song, Y. Zhu, C. Song, X. Fan and Z. You, Polymer, 2022, 260, 125402 CrossRef CAS.
- T. Wen, J. Lin, Z. Jiang, L. Han, W. Yang, H. Chen and X. Zhang, Microchem. J., 2024, 202, 110808 CrossRef CAS.
- S. Liang, T. Fang, W. Xiong, B. Ding, Y. Yan and J. Zhang, Comput. Mater. Sci., 2019, 170, 109177 CrossRef CAS.
- R. Bai, H. Wang, P. Zhang, B. Xiao, B. Jiang and G. Zhou, RSC Adv., 2015, 5, 57147–57154 RSC.
- L. Zhu, R. Jiang and C. Chen, Langmuir, 2024, 40, 8694–8702 CrossRef CAS PubMed.
- Y. Liu, B. Xin, M. A. A. Newton, L. Li and D. Huang, J. Water Process Eng., 2024, 59, 104969 CrossRef.
- W. Du, T. Wang, Z. Xie, L. Xia, J. Lu and P. Li, Sep. Purif. Technol., 2024, 340, 126838 CrossRef CAS.
- Z. Xu, Q. Liu and J. Chen, Materials Studio 7.0, Accelrys Software, San Diego, CA, 2023, 39, 332–339 Search PubMed.
- C. Xue, D. Ji, D. Cheng, Y. Wen, H. Luo and Y. Li, ACS Omega, 2022, 7, 41189–41200 CrossRef CAS PubMed.
- Y. Luo, Z. Liu, Y. Liu, J. Huang and M. Zhang, J. Appl. Polym. Sci., 2023, 140, e54364 CrossRef CAS.
- D. Steins, I. Sheret, H. Dawes, P. Esser and J. Collett, J. Biomech., 2014, 47, 3780–3785 CrossRef PubMed.
- D. Elliott, B. M. Johnston and P. R. Johnston, J. Comput. Appl. Math., 2016, 303, 93–104 CrossRef.
- Y.-X. Yuan, Optim. Methods Software, 1993, 2, 19–29 CrossRef.
- M. d. l. Á. Martínez and D. Fernández, Optim. Methods Software, 2019, 34, 634–649 CrossRef.
- T. S. Asche, P. Behrens and A. M. Schneider, J. Sol-Gel Sci. Technol., 2017, 81, 195–204 CrossRef CAS.
- A. Grauel, Z. Naturforsch. A, 1982, 37, 1–5 Search PubMed.
- C. Li, Y. Xiong, L. Zhao, H. Wan, J. Li, S. Fang, M. Wang, M. Duan, J. Ren and Y. Xiao, Langmuir, 2023, 39, 1694–1708 CrossRef CAS PubMed.
- L. Ning, Y. Liu, S. Man, Y. Han, L. Zhang, H. Ling and M. Zhang, J. Water Process Eng., 2023, 56, 104409 CrossRef.
| This journal is © The Royal Society of Chemistry 2024 |

