 Open Access Article
Enhanced photocatalytic hydrogen production via water splitting using cobalt-based organic nanofibers under visible light irradiation
Nasser A. M. Barakat *a,
Aghareed M. Tayeba,
Rahma Hamada,
Mohamed Hashemb,
Hassan Fouadc,
Hak Yong Kim
 de and
Rasha A. Hefnya
aChemical Engineering Department, Faculty of Engineering, Minia University, Minia 61516, Egypt. E-mail: nasbarakat@mu.edu.eg; Fax: +20862364420; Tel: +20862348005
bDepartment of Dental Health, College of Applied Medical Sciences, King Saud University, P. O. Box. 12372, Riyadh, Saudi Arabia
cBiomedical Engineering Department, Faculty of Engineering, Helwan University, Helwan, Egypt
dDepartment of Nano Convergence Engineering, Jeonbuk National University, Jeonju 54896, South Korea
eDepartment of Organic Materials and Fiber Engineering, Jeonbuk National University, Jeonju 54896, South Korea
First published on 31st October 2024
Abstract
This study focuses on the development of cobalt-based organic nanofibers as efficient photocatalysts for hydrogen production via water splitting under visible light irradiation. The depletion of fossil fuels necessitates the exploration of alternative energy sources, with hydrogen emerging as a promising candidate due to its clean and renewable nature. While conventional photocatalysts have shown potential, their limited activity under visible light and fast electron–hole recombination hinder their efficiency. In this work, cobalt acetate/poly(vinyl alcohol) (CoAc/PVA) nanofibers were electrospun and treated in a novel reactor design under water gas atmosphere at 160 °C to produce continuous, smooth, and stable nanobelts. The nanofibers displayed a band gap energy of 2.29 eV, indicating strong absorption in the visible light range. Detailed characterization using FTIR, XPS, SEM, and TGA confirmed the formation of organic–inorganic hybrid nanofibers with uniform cobalt distribution. Hydrogen production experiments showed that the proposed nanofibers significantly outperformed Co3O4 nanofibers, with an optimal hydrogen generation rate of 3.266 mmol gcat−1 s−1 at 70 vol% methanol. Furthermore, the treated nanofibers demonstrated good stability over multiple cycles, maintaining a constant hydrogen production rate after the third run. The study highlights the advantages of cobalt-based organic nanofibers in overcoming the limitations of traditional photocatalysts, providing a novel route for sustainable hydrogen production.
1. Introduction
The rapid depletion of fossil fuels and the growing concerns over their environmental impact have created an urgent need for alternative energy sources. Among the various options, hydrogen has emerged as one of the most promising candidates to replace fossil fuels due to its clean and renewable nature.1 Hydrogen combustion results in the production of water vapor as the only byproduct, making it an environmentally friendly fuel that could play a vital role in addressing both energy and environmental challenges.Several methods have been developed for hydrogen production, including steam methane reforming, coal gasification, and electrolysis.2 However, these traditional methods rely on fossil fuels, limiting their potential to achieve a sustainable, low-carbon future. In this context, green hydrogen, produced through renewable energy-powered processes, has gained significant attention.3 One of the most promising routes for green hydrogen production is water splitting driven by solar energy, also known as photocatalytic water splitting. This process uses sunlight to split water into hydrogen and oxygen, making it a highly sustainable and renewable method for hydrogen production.4
For efficient water splitting, the selection of an optimum photocatalyst is crucial. An ideal photocatalyst should have a band gap that allows for the absorption of visible light, which constitutes a large portion of the solar spectrum.5,6 However, many of the most commonly introduced photocatalysts have several limitations, including their applicability mostly under UV radiation and low photocatalytic efficiency due to the fast recombination of photogenerated electron–hole pairs.7
Extensive research has been conducted on inorganic semiconductors for photocatalytic water splitting, primarily focusing on half-reactions such as proton reduction and water oxidation, where sacrificial reagents are often used to suppress the opposing reaction.8,9 This has led to the development of systems with promising activity for overall water splitting.
In contrast, organic semiconductors have received significantly less attention, despite their potential due to the flexibility offered by a variety of synthetic methods. Reactions like palladium-catalyzed cross-coupling, including Suzuki–Miyaura,10,11 Stille,12 and Sonogashira13 coupling, have been extensively employed to produce photocatalysts, but these methods typically require monomers with two distinct functional groups, such as boronic acids and halides in Suzuki–Miyaura coupling. Other coupling techniques, like the Kumada reaction, also need different functional groups but can generate the Grignard reagent in situ from halogenated compounds.12 The Yamamoto coupling method, although it requires stoichiometric amounts of nickel(0), can combine halogenated compounds without additional functionalization.14
The challenge of water oxidation in organic materials arises from the need for low-lying HOMO levels and overcoming the kinetic barriers associated with the process.15 Although oxygen itself is not of high value, improving water oxidation is an essential step toward achieving overall water splitting with organic photocatalysts. Various metal-free methods have also been explored for synthesizing organic photocatalysts, including oxidative coupling,13 imine condensation,16 Knoevenagel condensation,17 and cyclotrimerization.18,19 These approaches yield polymeric materials that are free from metal impurities, which can act as unintended co-catalysts.
In 2007, the Cooper group introduced conjugated microporous polymers (CMPs) as a new class of porous materials,20 and by 2015, they demonstrated the ability to tune the optical properties of CMPs by varying the ratios of phenyl and pyrene units.21 Specific combinations of monomers produced polymers that were both stable and effective for hydrogen evolution from water, in the presence of TEA as a sacrificial electron donor, without the need for post-synthesis metal loading.22 Enhancing the performance of CMPs has been achieved by incorporating different building blocks, such as benzothiadiazole, dibromophenanthroline, dibenzothiophene sulfone, and benzothiadiazole derivatives.23
To date, there have been limited examples of organic photocatalysts capable of facilitating water oxidation, with many requiring a metal co-catalyst to overcome the kinetic challenges and the short-lived nature of photogenerated holes.24,25 Cobalt and ruthenium oxide co-catalysts are commonly used for this purpose, applied via techniques such as impregnation, photodeposition, or calcination.26–28 Alternatively, co-catalysts can be pre-synthesized and subsequently applied to the photocatalyst using methods like ultrasonication. In some cases, cobalt hydroxide has been formed in situ during alkaline treatments of cobalt salts in the presence of a photocatalyst.29,30
Generally, several cobalt-based compounds have shown great potential as photocatalysts in water splitting applications due to their favorable electronic properties and suitable band gap.31,32 They are also relatively abundant and stable. However, to further enhance their photocatalytic performance, it is essential to address the structural and electronic limitations that hinder their efficiency. One promising approach is to explore the use of nanostructured cobalt-based materials, particularly nanofibers, which offer several advantages over other nanostructures. Nanofibers provide a high surface area, large axial ratio, improved charge transport, and enhanced light absorption, making them excellent candidates for photocatalysis.33,34
The electrospinning technique is widely used for the production of nanofibers due to its simplicity, versatility, and ability to produce continuous nanofibers with controlled diameters.35 Electrospun nanofibers offer an network structure that facilitates better charge transfer, which is critical for improving the photocatalytic efficiency.36,37
In this study, we introduced a novel approach for the fabrication of organic-based cobalt-containing nanofibers through electrospinning, followed by a unique thermal treatment process in a water gas environment. The resulting nanofibers exhibited enhanced photocatalytic performance under visible light radiation for water splitting, leading to efficient green hydrogen production. This work presents a significant contribution to the field of photocatalysis and green hydrogen production by developing a high-performance, visible-light-active photocatalyst with improved stability and electron–hole separation efficiency. Methanol was used as an electron scavenger to facilitate the photocatalytic hydrogen generation process. Methanol plays a crucial role in suppressing the recombination of photogenerated electron–hole pairs by acting as a sacrificial agent, efficiently capturing holes and allowing electrons to participate in the reduction reaction to generate hydrogen. The use of methanol significantly enhances the overall hydrogen production rate by providing an alternative oxidation pathway, preventing the reverse reaction (water oxidation), which typically occurs when using water alone.38,39
2. Materials and methods
2.1 Materials
The following materials were used in this study: Cobalt(II) acetate tetrahydrate (CoAc, 98% assay), sourced from Junsei Chemical Co., Ltd, Japan. Poly(vinyl alcohol) (PVA) with a molecular weight of 65![[thin space (1/6-em)]](https://www.rsc.org/images/entities/char_2009.gif) 000 g mol−1, obtained from DC Chemical Co., Ltd, South Korea. Distilled water was used as the solvent throughout the experiment.
000 g mol−1, obtained from DC Chemical Co., Ltd, South Korea. Distilled water was used as the solvent throughout the experiment.
2.2 Preparation of electrospun CoAc/PVA nanofibers
To prepare the electrospinning solution, 1 g of cobalt acetate tetrahydrate was dissolved in 5 mL of distilled water to form an aqueous solution. Separately, a 10 wt% poly(vinyl alcohol) aqueous solution was prepared by dissolving PVA in distilled water. A volume of 15 mL of the 10 wt% PVA solution was then mixed with the 5 mL CoAc aqueous solution. This mixture was stirred continuously for 5 hours at 50 °C to ensure complete dissolution and homogeneity of the components. The prepared electrospinning solution was loaded into a syringe connected to the electrospinning setup. The electrospinning process was carried out under the following conditions: applied voltage of 20 kV, distance between the tip and collector is 15 cm and feeding rate 0.33 mL h−1. The solution was electrospun onto a rotating stainless steel drum collector, forming nanofibrous mats. Once the electrospinning process was complete, the obtained nanofiber mats were vacuously dried in an oven at 60 °C for 24 hours to remove any residual solvent and ensure structural stability.2.3 Reactor design and treatment of nanofibers
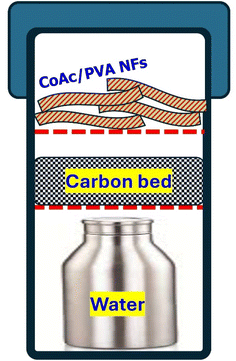
The dried nanofibrous mats were treated in a specially designed reactor. The reactor used in this study was a modified lab-scale autoclave reactor. The modifications to the autoclave were as follows: a metallic bottle filled with distilled water was placed inside the reactor to generate water vapor during the treatment process. Above the metallic bottle, a graphite granule bed (3 cm in thickness) was inserted to act as a source for carbon reacting with the released hot steam from the bottle to achieve water gas synthesis reaction (C + H2O = CO + H2). The electrospun nanofibers were enveloped in a stainless-steel mesh to prevent direct contact with the graphite bed and were then placed on top of the graphite granules within the autoclave. Once all the components were assembled inside the autoclave, the reactor was closed by its cover and placed in a furnace. Fig. 1 displays a schematic diagram for the designed reactor. The nanofibers were treated at a temperature of 160 °C for a duration of 10 hours. The combination of water gas and heat facilitated the chemical transformation and restructuring of the nanofibers into the desired morphology. After the 10 hour treatment, the autoclave was allowed to cool down to room temperature. The treated nanofibers were carefully removed from the stainless-steel mesh for further characterization and analysis.2.4 Water splitting experiment
In this study, water splitting experiments were performed using methanol as a sacrificial agent under simulated solar light irradiation to evaluate the photocatalytic activity of the prepared nanofibers. A 2000 W halogen lamp was employed as the source of solar light, simulating sunlight conditions to drive the photocatalytic reactions. The experiments were carried out using a methanol/water mixture with a 50![[thin space (1/6-em)]](https://www.rsc.org/images/entities/char_2009.gif) :
:![[thin space (1/6-em)]](https://www.rsc.org/images/entities/char_2009.gif) 50 vol% ratio as the reaction medium. A total of 100 mL of the methanol/water mixture was used for each experiment, and 10 mg of the photocatalyst was added to the reaction flask. The experiments were conducted at room temperature (25 °C) to eliminate the influence of temperature on the catalytic process and ensure that the photocatalytic activity of the nanofibers was solely driven by light absorption.
50 vol% ratio as the reaction medium. A total of 100 mL of the methanol/water mixture was used for each experiment, and 10 mg of the photocatalyst was added to the reaction flask. The experiments were conducted at room temperature (25 °C) to eliminate the influence of temperature on the catalytic process and ensure that the photocatalytic activity of the nanofibers was solely driven by light absorption.
2.5 Characterizations
XRD analysis was performed using a Rigaku X-ray diffractometer equipped with a Cu-Kα radiation source (λ = 1.5406 Å). The scanning was conducted over a 2θ range from 10° to 80°, with a step size of 0.02° and a scanning rate of 2° min−1. The XRD patterns were used to determine the crystalline phases of the nanofibers and identify the structural transformations that occurred during thermal treatment. FTIR spectra were recorded using a PerkinElmer Spectrum 100 FTIR spectrometer in the range of 4000–400 cm−1. The attenuated total reflectance (ATR) mode was applied to ensure accurate identification of functional groups present in the nanofibers. FTIR analysis allowed for the examination of the chemical bonds and molecular structure changes during the thermal decomposition and post-treatment. XPS measurements were conducted using a Thermo Scientific K-Alpha XPS system equipped with a monochromatic Al-Kα X-ray source (1486.6 eV). The survey and high-resolution spectra were recorded at a pressure of 10−9 mbar. The spectra were calibrated using the C 1s peak at 284.8 eV as a reference. The XPS analysis provided information about the surface elemental composition, oxidation states, and chemical environment of the elements present in the nanofibers. TGA was performed using a TA Instruments Q50 thermogravimetric analyzer under an air atmosphere. The samples were heated from room temperature to 800 °C at a rate of 10 °C min−1. This analysis was used to assess the thermal stability and decomposition behavior of the nanofibers. The weight loss profile provided information on the different stages of thermal degradation, the release of volatile components, and the final residue composition, confirming the formation of Co3O4 as the residual solid.UV-Vis spectra were recorded using a JASCO V-770 UV-Vis-NIR spectrophotometer over the wavelength range of 200 to 1200 nm. The diffuse reflectance spectra were converted into absorbance using the Kubelka–Munk function to estimate the optical band gap of the nanofibers. This technique provided insights into the light absorption capabilities of the nanofibers, which is crucial for their photocatalytic applications. The morphology of the nanofibers was examined using a JEOL JSM-7610F scanning electron microscope (SEM) operating at 15 kV. The SEM images were captured at different magnifications to observe the surface morphology, fiber uniformity, and any structural changes induced by the thermal treatment. Elemental mapping was performed using EDX integrated with the SEM. This technique provided detailed information on the elemental distribution of cobalt, carbon, and oxygen across the nanofibers.
3. Results and discussion
3.1 Catalyst morphology
The SEM images presented in Fig. 2A and B reveal that the treated nanofibers maintain their fibrous morphology even after exposure to the proposed treatment strategy under water gas atmosphere at 160 °C. Despite the high temperature and reactive gas environment, the nanofibers exhibit a continuous, smooth structure without any visible beads or irregularities, which is a significant indicator of the stability of the nanofiber fabrication process and the treatment's non-disruptive nature.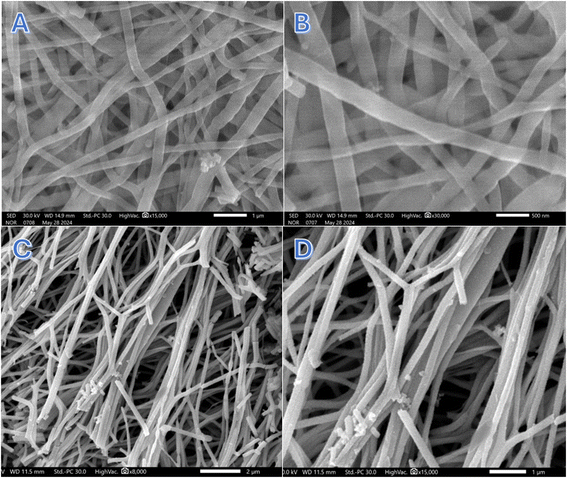 | ||
| Fig. 2 Two magnifications SEM images for the treated nanofibers; (A and B) and Co3O4 nanofibers; (C and D). | ||
Interestingly, the nanofibers appear to have undergone a transformation into nanobelts. This morphological change can be attributed to the high-pressure conditions inside the custom-designed reactor, which likely exerted compressive forces on the nanofibers. Under such pressures, the cylindrical geometry of the nanofibers could have been flattened or elongated, resulting in the belt-like structure observed in the SEM images. The smooth surface of the nanobelts suggests that the water gas environment and elevated temperature not only preserved the integrity of the nanofibers but also facilitated a gradual reconfiguration of the fibers into nanobelts without inducing surface defects. Overall, these SEM results confirm that the proposed reactor setup and treatment strategy are effective in modifying the nanofibrous morphology into a more advantageous belt-like form without compromising the material's quality.
Calcination of the CoAc/PVA electrospun nanofibers at 500 °C in air led to the formation of interconnected nanofibers with a rough surface, as shown in Fig. 2C and D. This rough surface can provide more active sites for photocatalytic reactions. However, compared to the calcined nanofibers, the continuous and smooth discrete nanobelts obtained through the proposed treatment method may exhibit superior photocatalytic activity. The nanobelts, with their uniform morphology and higher surface area, can enhance light absorption and facilitate efficient charge transport.
3.2 Chemical composition
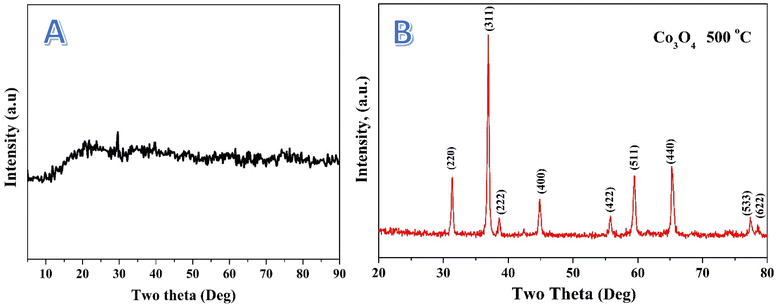
The X-ray diffraction (XRD) pattern presented in Fig. 3A for the treated nanofibers shows a peak at ∼27° (2θ), which is indicative of an amorphous or poorly crystalline graphite.40 The absence of other sharp diffraction peaks suggests that the treated nanofibers do not possess long-range crystalline order. This is consistent with materials that have undergone extensive thermal or chemical treatments, leading to either the formation of amorphous phases or the generation of nanostructured components that are too small to produce significant diffraction.Additionally, the minor bumps observed in the broad hump may correspond to traces of nanocrystalline domains that are either too small or too disordered to give well-defined peaks. The lack of distinct peaks for cobalt oxides, which might be expected in a highly crystalline material, further supports the hypothesis that the cobalt species present in the nanofibers are either amorphous or in a highly dispersed phase. This finding is aligned with the XPS results (below), which suggest the presence of cobalt in various oxidation states, including Co(OH)2, organic cobalt, and Co3O4, though these species are not seen as crystalline phases in the XRD pattern. On the other hand, calcination of the electrospun CoAc/PVA nanofibers led to produce Co3O4 nanofibers as it can be concluded from the XRD analysis as shown in the corresponding pattern in Fig. 3B. Typically, the observed strong and sharp diffraction peaks at 2θ values of 31.35, 36.98, 44.93, 59.52 and 65.36° corresponding to (220), (311), (400), (511) and (440) crystal planes confirms the formation of cubic crystalline Co3O4 (JCDPS, card no. 42-1467).
Basically, it was observed that the prepared nanofibers are insoluble in water. Accordingly, it is highly expected, due to treatment under high-temperature treatment (160 °C) in a water gas environment and the water-insolubility of the nanofibers, both PVA and cobalt acetate have undergone significant chemical changes. The high temperature likely led to decomposition, crosslinking, or formation of new compounds. FTIR analysis is a powerful tool to check the new chemical bonds. Fig. 4 display FTIR spectra for the initial CoAc/PVA nanofibers, the treated nanofibers and, Co3O4 nanofibers prepared by calcination of the CoAc/PVA nanofibers in air atmosphere at 700 °C.41,42
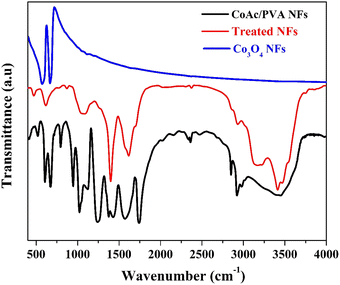 | ||
| Fig. 4 FTIR spectra of the original CoAc/PVA electrospun nanofibers, the treated nanofibers and Co3O4 nanofibers. | ||
Basically, the characteristic absorption bands for PVA can be observed at 3249 cm−1, which corresponds to O–H stretching, and at 2936 cm−1 for asymmetric CH2 stretching. The symmetric CH2 stretch is seen at 2906 cm−1, while the peak at 1643 cm−1 is attributed to water absorption. The bending of CH2 appears at 1416 cm−1, and the δ (OH) rocking, accompanied by CH wagging, occurs at 1325 cm−1. The crystalline form of PVA shows a C–O shoulder stretch at 1138 cm−1, while the amorphous form features a C–O stretch and OH bending at 1083 cm−1. Additional peaks include CH2 rocking at 916 cm−1 and C–C stretching at 822 cm−1.43,44
On the other hand, based on literature, the FTIR spectrum of cobalt acetate tetrahydrate (CoAc) reveals key peaks between 500–700 cm−1, corresponding to acetate modes (v5, v11, v15), with the 537 cm−1 peak indicating water liberation and the 610 cm−1 peak representing CO2 rocking. Water-related bands are observed at 742, 810, and 883 cm−1, associated with wagging and twisting of crystallization water molecules. A C–C stretching vibration occurs at 949 cm−1, while CH3 symmetric bending appears at 1351 cm−1. Between 1400–1475 cm−1, overlapping CO and CH3 stretching bands are present, and broad OH stretching peaks are seen at 3131 cm−1 and 3496 cm−1.45,46
However, the IR spectrum of Co3O4 features two characteristic bands linked to the stretching vibrations of metal–oxygen bonds. The first band, appearing at 570 cm−1, corresponds to the OB3 vibration within the spinel structure, where B represents Co3+ in an octahedral site. The second band, observed at 664 cm−1, is attributed to the ABO3 vibration, with A signifying Co2+ occupying a tetrahedral site.45,47
Accordingly, the observed peaks in the FTIR spectrum of the treated nanofibers can be identified as follow:
(1) The peak at 478 cm−1 (very small peak) may be attributed to metal–oxygen (Co–O) vibrations, suggesting the formation of cobalt-related compounds. The small size indicates that this could correspond to a weak or less crystalline cobalt oxide phase.
(2) The peak 621 cm−1 (medium peak) is likely due to metal–oxygen bonding (Co–O) in cobalt oxide species. Despite the lack of XRD peaks, the FTIR signal indicates cobalt oxide-like formation, as Co3O4 exhibits similar peaks around 664 cm−1. Given the environment, cobalt species may have formed in a non-crystalline or amorphous state, undetectable by XRD.
(3) The peak at 1072 cm−1 (medium and broad with platform) corresponds to C–O stretching or O–H bending. After treatment, PVA likely decomposed or crosslinked, so the C–O functionality could be part of newly formed organic compounds in the nanofibers.
(4) The strong peak at 1400 cm−1 could be associated with CH2 bending, which may still be present in a modified form after the degradation or crosslinking of PVA. Additionally, it might indicate the presence of carbonyl groups (C![[double bond, length as m-dash]](https://www.rsc.org/images/entities/char_e001.gif) O) formed during the thermal treatment from the decomposition of cobalt acetate or PVA.
O) formed during the thermal treatment from the decomposition of cobalt acetate or PVA.
(5) The broad peak at 1622 cm−1 is likely due to water absorption and the presence of conjugated C![[double bond, length as m-dash]](https://www.rsc.org/images/entities/char_e001.gif) O bonds, which might have formed during the thermal treatment. The broadness suggests interaction with water gas during the process, leading to some residual hydroxyl or carbonyl groups.
O bonds, which might have formed during the thermal treatment. The broadness suggests interaction with water gas during the process, leading to some residual hydroxyl or carbonyl groups.
(6) The small peak at 2931 cm−1 corresponds to asymmetric stretching of CH2 groups, though after high-temperature treatment, it might also indicate remnants of PVA or its thermally decomposed products. The CH2 groups could have partially degraded but still contribute to this signal.
(7) The medium and broad peak at 3192 cm−1 corresponds to O–H stretching vibrations. After the treatment, these groups may originate from the hydroxyl groups in residual PVA fragments or from water molecules adsorbed during the water gas process. The broadness suggests hydrogen bonding.
(8) The shoulder at 3421 cm−1 is likely due to the stretching of O–H bonds from hydroxyl groups. The shoulder indicates possible crosslinking or chemical changes in the PVA structure after the high-temperature treatment. It might also point to the formation of water-insoluble polymeric or cobalt-containing species.
Overall, the FTIR analysis pointed towards significant changes in both cobalt acetate and PVA, indicating the formation of cobalt-containing compounds and residual organic material after the high-temperature treatment. The high-temperature treatment likely led to the formation of cobalt oxide or cobalt-containing compounds and the crosslinking/decomposition of PVA, resulting in new chemical structures and the loss of water solubility.
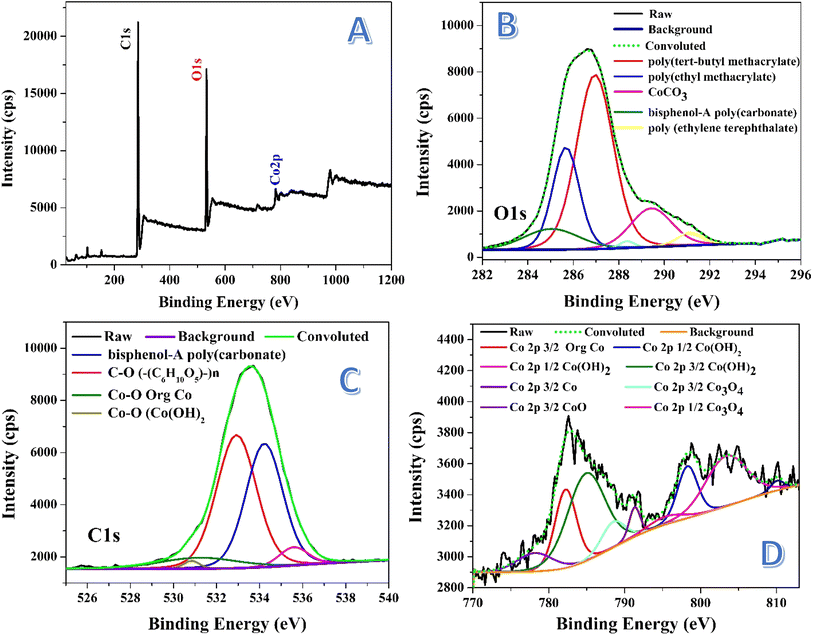
X-ray photoelectron spectroscopy (XPS) is a powerful technique used to analyze the surface composition of materials by measuring the binding energies of electrons ejected from atoms. In the survey spectrum, each element typically shows a broad peak corresponding to a specific electron energy level. However, when these peaks are studied in detail, they often split into multiple peaks due to factors like spin–orbit coupling, chemical shifts, and variations in oxidation states. This splitting provides more detailed information about the chemical environment and the specific bonding states of the elements in the material. Fig. 5 displays the XPS analyses for the prepared nanofibers. Fig. 5A represents the survey spectrum, as shown the characteristic peaks of C 1s, O 1s and Co 2p orbitals. Fig. 5B introduces detailed information about the O 1s peak. As shown, deconvolution of this peak resulted in getting several peaks with different areas under these peaks. The deconvoluted peak, which covers the maximum area (46.56%), at 532.9 eV assigned to oxygen in (C6H10O5)n indicates the presence of polysaccharide-like structures, which may arise from PVA decomposition and subsequent crosslinking.48 The second species content, based on the area under the peak, can be suggested as bisphenol-A poly(carbonate). Typically, the deconvoluted peak at 534.2 eV, covering an area of 40.06%, assigned to oxygen in bisphenol-A poly(carbonate), indicating a significant portion of polymeric material in the nanofibers.49 This suggests the formation of complex organic polymer chains, potentially formed from modified PVA. There are other two additional peaks at 531.9 and 530.8 eV, covering small areas; 7.56% and 1.1%, respectively indicating presence of cobalt in the surface of the treated nanofibers. The peaks at 531.9 and 530.8 eV can be assigned to Co–O in Co(OH)2 and tris(2,4-pentanedionato-O,O′)cobalt, respectively indicating the formation of cobalt hydroxide.50,51 Small area percentages suggest minor contributions of these two compounds.
Fig. 5C illustrates the deconvolution of the C 1s peak, revealing multiple carbon species. The peak at 285 eV (9.28%) is attributed to bisphenol-A polycarbonate, suggesting the formation of a polycarbonate-like structure, likely due to the thermal decomposition and restructuring of PVA.52 At 285.68 eV (22.21%), the peak is assigned to poly(ethyl methacrylate),53 indicating additional polymeric structures that may have formed from the interaction of PVA breakdown products with cobalt complexes or other decomposition by-products. The dominant peak at 286.98 eV (51.95%) corresponds to poly(tert-butyl methacrylate),48 showing that methacrylate-like structures are the primary carbon species in the nanofibers, possibly arising from modifications to PVA. A peak at 289.4 eV (12.95%) is associated with cobalt carbonate (CoCO3),54 suggesting that cobalt acetate reacted with CO2 released during PVA decomposition or from the water gas treatment. Lastly, the peak at 291.1 eV (2.82%) indicates the presence of poly(ethylene terephthalate) (–CH2CH2OC(O)C6H4C(O)O–)n,55 representing a minor polymeric structure formed during the thermal process.
The deconvolution of the Co 2p peak in Fig. 5D reveals a complex spectrum with multiple components, confirming the presence of various cobalt species in the nanofibers. The peak at ∼782 eV (16.66%) is attributed to tris(2,4-pentanedionato-O,O′)cobalt,51 consistent with the O 1s peak at 531.9 eV observed in XPS, indicating that this cobalt complex remained intact or reformed after thermal treatment. The presence of this complex suggests that cobalt acetate may have partially transformed into organometallic compounds during the process. A significant peak at 798 eV (10.28%) corresponds to Co(OH)2,56 which aligns with the O 1s peak at 530.8 eV. This confirms the presence of cobalt hydroxide, possibly formed as a result of interaction between cobalt species and water gas during the treatment. The existence of Co(OH)2 in the sample is further supported by the FTIR data, which shows broad O–H stretching bands, possibly related to hydroxide groups.
Another important binding energy observed at ∼103 eV corresponds to either 3s in CoO57,58 or 2p3/2 in Co3O4.59. This suggests that cobalt is present in oxide forms, though the absence of clear XRD peaks for crystalline oxides indicates that these oxides might be amorphous or poorly crystalline. This observation is consistent with the XRD results, which did not show distinct peaks for cobalt oxides, implying that the oxide phases are not well-ordered or are present in small quantities. The FTIR spectrum, however, did not show the typical metal–oxygen stretching vibrations around 570 and 664 cm−1 that would be expected for Co3O4, further supporting the idea that cobalt oxide is amorphous or exists in small amounts.
The additional peaks observed at 778, 787, 788, 789, 795, and 803 eV in the Co 2p spectrum are indicative of various cobalt oxidation states, including Co(OH)2, CoO, and Co3O4.56,60 This suggests a complex mixture of cobalt species, with both Co2+ and Co3+ states present. The coexistence of multiple oxidation states and hydroxide and oxide forms highlights the multifaceted nature of the nanofiber structure after treatment, where the chemical environment promotes the formation of various cobalt compounds. The absence of clear crystalline oxide signals in XRD, combined with the presence of these species in XPS, underscores the likelihood that cobalt oxides and hydroxides are either amorphous or exist as small particles dispersed within the nanofiber matrix.
Overall, the XPS results provide a deeper understanding of the cobalt species' complex chemical environment, supporting the findings from FTIR and XRD. While FTIR and XRD do not reveal strong evidence of crystalline cobalt oxides, XPS confirms the presence of both hydroxide and oxide forms in varying oxidation states, suggesting a nuanced transformation of cobalt acetate and PVA during the thermal treatment process.
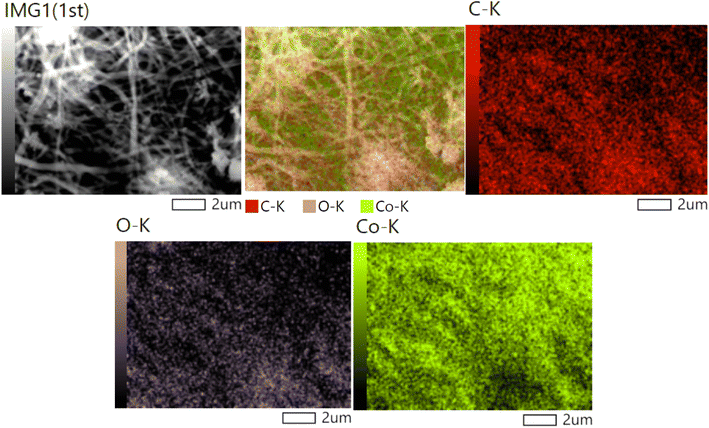
The elemental analysis of the introduced nanofibers (Fig. 6) reveals the uniform distribution of carbon, oxygen, and cobalt (Co) across the nanofibers, which holds significant implications for both the structure and functionality of the material. The homogeneity in the elemental distribution supports the formation of a well-integrated nanocomposite, where all elements contribute to the material's overall properties. The uniform cobalt distribution suggests that the electrospinning and subsequent thermal treatment processes were effective in creating a homogenous material where cobalt is uniformly incorporated into the nanofibers. The presence of uniformly distributed Co enhances the catalytic performance by ensuring a consistent and accessible catalytic surface throughout the nanofibers. The presence of carbon is attributed to the decomposition of poly(vinyl alcohol) (PVA) used during the electrospinning process. FTIR and XPS data would show that after thermal treatment, residual carbon remains in the form of organic compounds. The carbon's role as a conductive matrix could also assist in reducing recombination rates of electron–hole pairs, enhancing the photocatalytic efficiency of the material. The FTIR results, confirming the transformation of PVA and the possible presence of C–O or C![[double bond, length as m-dash]](https://www.rsc.org/images/entities/char_e001.gif) O bonds, further strengthen this argument. The XPS analysis would also show shifts in carbon peaks, suggesting interactions between carbon and cobalt oxide. The presence of carbon and cobalt is further supported by TGA results.
O bonds, further strengthen this argument. The XPS analysis would also show shifts in carbon peaks, suggesting interactions between carbon and cobalt oxide. The presence of carbon and cobalt is further supported by TGA results.
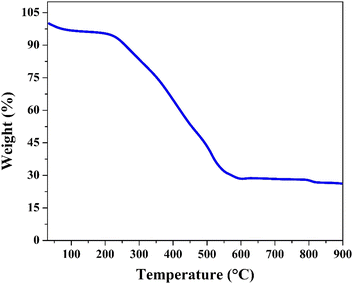
The thermogravimetric analysis (TGA) curve of the treated nanofibers, conducted in an air atmosphere (Fig. 7), shows a multi-step weight loss pattern as the temperature increases from room temperature to 900 °C. The initial weight slightly decreases as the temperature rises to around 100 °C, indicating the loss of adsorbed water and any other volatile components. This is consistent with the presence of residual moisture and volatile degradation products from the polyvinyl alcohol (PVA) used during the electrospinning process.
The significant weight loss observed between 200 °C and 500 °C corresponds to the decomposition of organic components in the nanofibers which was confirmed earlier by FTIR analysis. This decomposition involves the breakdown of polymeric chains, leaving behind inorganic cobalt species. The onset of this major weight loss indicates that the organic compounds begin to degrade in this temperature range, further corroborating with the XPS and FTIR results, which suggested the presence of cobalt complexes that may interact with the degradation products. The peak between 285 eV and 291 eV in the XPS C 1s spectrum was assigned to various polymeric species, which are thermally decomposed at these temperatures.
As the temperature approaches 500 °C, the weight stabilizes, indicating the complete combustion of organic residues. The remaining solid material, with a final weight near 30%, is cobalt oxide (Co3O4). The thermal stability of the inorganic cobalt-based phase is evident beyond 500 °C, where no significant weight loss is observed, confirming that Co3O4 remains intact and does not further oxidize or decompose under the conditions of the TGA analysis in air. This result indicates that the cobalt content in the treated nanofibers is around 21 wt%. However, based on the used amounts of cobalt acetate tetrahydrate and poly(vinyl alcohol), maximum content of cobalt in the initial electrospun CoAc/PVA nanofibers is 9.6 wt%. Therefore, this another proof for the strong change in the chemical composition upon the proposed treatment strategy.
3.3 Optical properties
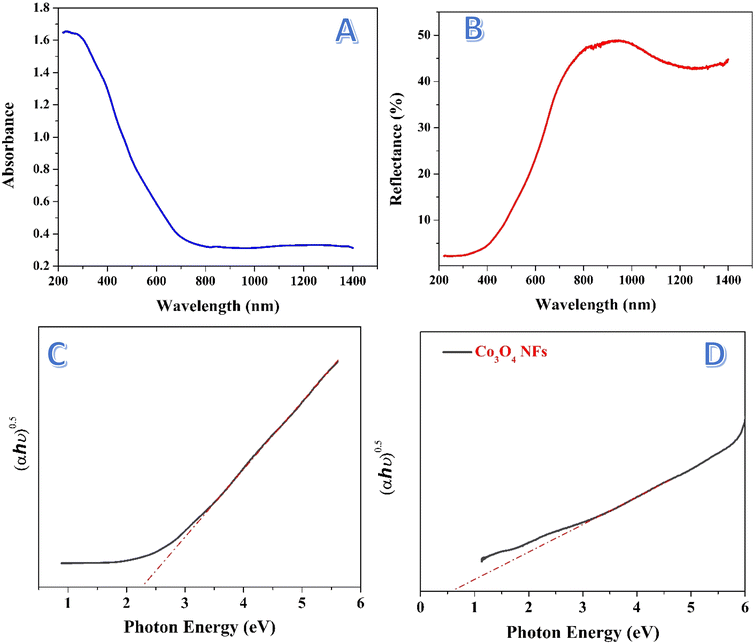
The absorbance spectrum presented in Fig. 8A shows the ability of the treated nanofibers to absorb light across a wide range of wavelengths, extending from the UV region (∼200 nm) to the visible and even near-infrared (∼1400 nm). The absorbance starts high in the UV region and then gradually decreases as the wavelength increases, reaching a lower absorbance level in the visible and near-infrared regions. The treated nanofibers exhibit a broad absorption spectrum, particularly absorbing strongly in the UV and visible regions. This broad absorption indicates that the nanofibers are capable of harvesting light over a wide range of wavelengths, which is a crucial property for applications in photocatalysis. In particular, the strong absorption in the visible light range (∼400–700 nm) is significant, as visible light accounts for most of the solar radiation.The Kubelka–Munk (K–M) plot is a commonly used method to estimate the band gap energy of semiconductors based on their diffuse reflectance or absorption spectra.61 It provides valuable insight into the optical properties of materials by linking the absorbance data to the band structure of the material. The Kubelka–Munk function (F(R∞)),62 is derived from the reflectance data and is applied to estimate the band gap energy for semiconductors using the Tauc method. The function is expressed as:
 | (1) |
| (F(R∞) × hν)n = A(hν − Eg) | (2) |
The band gap of 2.29 eV corresponds to light absorption at a wavelength of approximately 540 nm, which lies in the visible light region. This is highly advantageous for photocatalytic applications, as visible light constitutes a significant portion of the solar spectrum, making the nanofibers capable of efficiently utilizing sunlight. Compared to traditional photocatalysts such as TiO2 which mainly absorb UV light, which constitutes only about 4% of the solar spectrum, whereas the visible region constitutes about 43%. Thus, the treated nanofibers are more efficient for solar-driven processes. Fig. 8D shows Tauc plot for the prepared Co3O4 nanofibers. As shown, the estimated band gap is around 0.6 eV which indicates poor photocatalytic activity of these nanofibers under the visible light irradiation.
3.4 Photocatalytic activity
As shown in Fig. 9, the hydrogen generation rate from the methanol/water (50% vol% methanol) solution demonstrates a significant difference between the prepared organic cobalt nanofibers and the Co3O4 nanofibers, with the organic cobalt nanofibers producing 2.122 mmol H2 per gcat per s of hydrogen, while the Co3O4 nanofibers produce only 0.187 mmol H2 per gcat per s.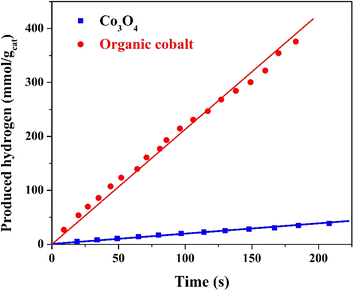 | ||
| Fig. 9 Hydrogen generation rate from methanol/water solution (50% methanol) under visible radiation using the treated and Co3O4 nanofibers. | ||
This difference in hydrogen production is striking and suggests several key factors that contribute to the superior catalytic activity of the treated nanofibers. The organic cobalt nanofibers, composed of different cobalt-based compounds embedded in organic compounds and carbon matrix (as inferred from the synthesis and characterization, including FTIR and XPS), exhibit a synergistic effect between the cobalt species and the other species. Carbon provides better electron conductivity, which facilitates the transfer of electrons generated during the photocatalytic reaction. This is particularly important in water splitting, where the electron–hole pairs produced need to be efficiently separated and directed to the active sites.
The cobalt species in the treated nanofibers, likely including a mixture of different oxidation states such as Co2+ and Co3+, play a critical role as active sites for the water splitting reaction.65 The presence of both oxidation states could offer more active catalytic sites compared to Co3O4 alone, improving the overall reaction kinetics. Moreover, the organic compounds/carbon matrix may improve light-harvesting efficiency by reducing reflection and scattering, making the overall material more effective at absorbing photons.
The band gap of the treated nanofibers (∼2.29 eV) is ideal for absorbing visible light and generating charge carriers with enough energy to drive the water splitting reactions. In contrast, Co3O4 has a lower band gap (∼0.6 eV), which allows it to absorb light over a broader range, including infrared. Finally, the observed superior activity of the organic cobalt nanofibers compared to the single oxide nanofibers can be attributed to the synergetic effect of the different species in the prepared complex nanofibers. On the other hand, Co3O4 is a pure material, and the absence of a synergistic interaction means that its photocatalytic activity is inherently limited by its intrinsic properties, such as surface area and charge carrier dynamics.
The surface chemistry of the treated nanofibers, as confirmed by FTIR and XPS analyses, shows the presence of cobalt oxides and carbon-related species, which may introduce additional functional groups that enhance reactants adsorption and subsequent oxidation. These functional groups could act as active centers for water splitting, speeding up the reaction rate and boosting hydrogen production.
The results regarding hydrogen generation from water photo splitting using methanol as a scavenger show interesting trends. Methanol, in this case, plays a critical role by acting as a hole scavenger, preventing electron–hole recombination and thus enhancing the photocatalytic efficiency of the nanofibers.66,67 The increase in hydrogen production rate with increasing methanol content up to 70 vol% (Fig. 10) can be attributed to the higher availability of methanol molecules to scavenge the photogenerated holes. This reduces recombination losses and maximizes the number of electrons available for hydrogen generation from water.
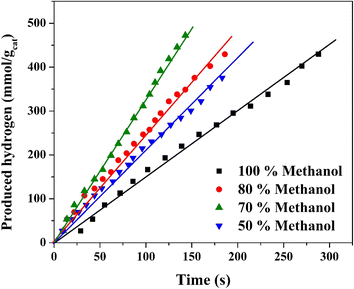 | ||
| Fig. 10 Effect of methanol content on the hydrogen generation rate from methanol/water solution under visible radiation using the treated nanofibers. | ||
At 70 vol% methanol, the hydrogen production rate reaches its peak (3.266 mmol H2 per gcat per s), which implies that the balance between methanol content and water concentration provides optimal scavenging activity while ensuring sufficient water for hydrogen generation. Beyond this percentage (80% and 100% methanol), the rate begins to decline, likely due to excessive methanol limiting the amount of water available for splitting. Additionally, methanol may start to absorb more of the incident light or hinder the access of active sites on the catalyst for water molecules, further reducing the efficiency of the process. At pure methanol solution, the reaction transfers to methanol reforming reaction.
The hydrogen production performance of the prepared organic cobalt nanofibers over six successive days under direct sunlight radiation provides significant insights into both the stability and practical applicability of the photocatalyst. The experimental data, as displayed in Fig. 11, reflect the variation in hydrogen production rates during the course of outdoor water splitting reactions, with fluctuations in the early stages and stabilization over time, highlighting key advantages of the nanofibers in real-world conditions.
 | ||
| Fig. 11 Stability of the proposed treated nanofibers as a photocatalyst for hydrogen generation from methanol/water solution (70% methanol) under solar radiation within 6 days working time. | ||
On the first day of experimentation, hydrogen production rates showed some instability across the eight consecutive runs. The rate began at 0.267 mmol H2 per gcat per s in the first run but increased to a maximum of 0.426 mmol H2 per gcat per s by the fifth run. This initial fluctuation may be attributed to several factors, such as the gradual adjustment of the nanofiber surface to outdoor environmental conditions (e.g., varying sunlight intensity or temperature). The relatively high rate in the fifth run could suggest an optimal stabilization of the photocatalyst, wherein electron–hole recombination is minimized, and the photocatalytic surface becomes fully active after initial exposure to sunlight. The lowest observed rate of 0.183 mmol H2 per gcat per s in the sixth run suggests a potential temporary deactivation of some catalytic sites or a slight variation in sunlight conditions, but the general trend indicates promising activation of the photocatalyst.
The second day's results show greater consistency, with the hydrogen production rate peaking at 0.416 mmol H2 per gcat per s in the first run and stabilizing with an average rate of 0.322 mmol H2 per gcat per s across subsequent runs. This reflects the improved stability and reusability of the prepared nanofibers, as the photocatalyst demonstrates consistent activity with reduced fluctuations compared to the first day. This consistency in performance suggests that the nanofibers have adapted well to the outdoor conditions, maintaining effective charge separation and photocatalytic activity over multiple runs.
By the sixth day, the nanofibers continued to exhibit stable photocatalytic performance with an average hydrogen production rate of 0.287 mmol H2 per gcat per s. The decrease in performance during the early cycles could be attributed to surface changes or slight degradation of the active sites on the nanofibers, a common occurrence in photocatalytic reactions where surface contamination or rearrangement may occur.68,69 The relatively stable rates observed throughout the eight runs on this day indicate that the prepared nanofibers retain their photocatalytic efficiency over time, showing minimal degradation even after prolonged exposure to direct sunlight. This long-term stability is crucial for practical applications, where photocatalysts need to maintain performance over extended periods to be commercially viable.
The stability and performance of the nanofibers under sunlight can be attributed to their unique structure and chemical composition. The organic-cobalt composition likely enhances charge separation, minimizing the recombination of photogenerated electron–hole pairs, which is a common limitation in many inorganic photocatalysts. Additionally, the nanofiber morphology provides a high surface area, promoting efficient interaction between the photocatalyst and reactants (water and methanol), further enhancing hydrogen generation. The presence of methanol as a scavenger plays a crucial role in improving the photocatalytic performance by capturing holes and preventing electron–hole recombination, thus sustaining high hydrogen production rates.
Overall, the prepared organic cobalt nanofibers have demonstrated exceptional stability and effectiveness under direct sunlight, making them a promising candidate for practical photocatalytic water splitting. The observed hydrogen production rates, combined with the catalyst's resilience over six days of outdoor experimentation, suggest that these nanofibers could play a vital role in future solar-to-hydrogen energy conversion systems, promoting sustainable green hydrogen production.
The superior photocatalytic performance of the treated nanofibers can be attributed to several factors related to the material's unique morphology, structure, and processing:
• The electrospinning technique plays a critical role in determining the morphology and surface area of the nanofibers. The process produces continuous, uniform nanofibers with a high surface-to-volume ratio. This unique fibrous structure enhances light absorption by allowing more photons to interact with the material's surface, improving the efficiency of the photocatalytic process. Additionally, the nanofibrous morphology provides increased active surface area, which promotes more efficient interaction between the photocatalyst and the reactants (methanol and water), leading to higher hydrogen production rates.70
• The nanofiber structure offers enhanced charge carrier mobility, reducing the recombination of photogenerated electron–hole pairs. This improved separation of charge carriers is crucial for sustaining the redox reactions required for photocatalytic hydrogen production. The interconnected network of nanofibers provides a pathway for efficient electron transport, facilitating faster and more efficient charge transfer to the reaction sites.71
• The treatment process used in the reactor enhances the surface characteristics of the nanofibers, ensuring better stability and longer-lasting photocatalytic performance compared to conventional cobalt oxides or other photocatalytic materials.
• The treated nanofibers possess an optimal band gap of 2.29 eV, allowing them to efficiently absorb visible light. This is a key advantage over conventional photocatalysts that are typically limited to UV light absorption. The increased light absorption in the visible range contributes to the higher photocatalytic activity of the treated nanofibers.
4. Conclusions
In conclusion, this study successfully demonstrates the development of cobalt-based organic nanofibers as highly efficient photocatalysts for hydrogen production via water splitting under visible light. The nanofibers, produced through electrospinning and treated in a specially designed reactor, exhibit a unique organic–inorganic hybrid structure, as confirmed by various analytical techniques. The treated nanofibers showed strong visible light absorption with a band gap energy of 2.29 eV, making them suitable for solar-driven hydrogen generation. The hydrogen production experiments revealed that the treated nanofibers significantly outperformed traditional Co3O4 nanofibers, with a maximum hydrogen generation rate of 3.266 mmol gcat−1 s−1 at 70 vol% methanol. Additionally, the treated nanofibers exhibited good stability, maintaining their performance over multiple water-splitting cycles. These findings highlight the potential of using cobalt-based organic nanofibers for green hydrogen production, offering a promising solution to the limitations of conventional photocatalysts and contributing to the advancement of sustainable energy technologies.Data availability
The experimental data for X-ray diffraction (XRD), Fourier-transform infrared spectroscopy (FTIR), X-ray photoelectron spectroscopy (XPS), thermal gravimetric analysis (TGA), ultraviolet-visible (UV-Vis) spectroscopy, and scanning electron microscopy (SEM) with energy-dispersive X-ray spectroscopy (EDS) mapping analyses, as well as the data for hydrogen generation rates during water splitting experiments are available in the main manuscript file.Author contributions
Nasser A. M. Barakat; writing initial manuscript draft, data interpretation and study design, Aghareed Tayeb; supervision, data collection, Rahma Hamad; experimental work, data collection; Hassan Fouad and Mohamed Hashem; funding acquisition, Hak Yong Kim; data collection, and Rasha Hefny; data analysis.Conflicts of interest
The authors declare that they have no conflict of interest.Acknowledgements
This work is funded by Researcher supporting project number (RSPD2024R680), King Saud University, Riyadh, Saudi Arabia.References
- I. Vinoth Kanna and P. Paturu, Int. J. Ambient Energy, 2020, 41, 1433–1436 CrossRef CAS.
- P. Nikolaidis and A. Poullikkas, Renewable Sustainable Energy Rev., 2017, 67, 597–611 CrossRef CAS.
- Y. Zhou, R. Li, Z. Lv, J. Liu, H. Zhou and C. Xu, Chin. J. Chem. Eng., 2022, 43, 2–13 CrossRef CAS.
- N. A. Barakat, E. Ahmed, M. T. Amen, M. A. Abdelkareem and A. Farghali, Mater. Lett., 2018, 210, 317–320 CrossRef CAS.
- X. Zhou, L. Peng, L. Xu, J. Luo, X. Ning, X. Zhou, F. Peng and X. Zhou, Chem. Eng. J., 2023, 474, 145967 CrossRef CAS.
- M. Chen, S. Li, S. Zhong, X. Zhou, Y. Ge, J. Luo, X. Zhou, X. Zhou and Y. Zhong, J. Alloys Compd., 2023, 947, 169515 CrossRef CAS.
- N. M. Gupta, Renewable Sustainable Energy Rev., 2017, 71, 585–601 CrossRef CAS.
- Y. Bai, K. Hippalgaonkar and R. S. Sprick, J. Mater. Chem. A, 2021, 9, 16222–16232 RSC.
- Y. Liao, L. Peng, X. Zhou, J. Luo, L. Xu, X. Ning, X. Zhou, X. Zhou and Y. Fang, Appl. Surf. Sci., 2023, 639, 158158 CrossRef CAS.
- R. S. Sprick, B. Bonillo, R. Clowes, P. Guiglion, N. J. Brownbill, B. J. Slater, F. Blanc, M. A. Zwijnenburg, D. J. Adams and A. I. Cooper, Angew. Chem., Int. Ed., 2016, 55, 1792–1796 CrossRef CAS.
- Y. Bai, L. Wilbraham, B. J. Slater, M. A. Zwijnenburg, R. S. Sprick and A. I. Cooper, J. Am. Chem. Soc., 2019, 141, 9063–9071 CrossRef CAS.
- R. S. Sprick, C. M. Aitchison, E. Berardo, L. Turcani, L. Wilbraham, B. M. Alston, K. E. Jelfs, M. A. Zwijnenburg and A. I. Cooper, J. Mater. Chem. A, 2018, 6, 11994–12003 RSC.
- L. Wang, Y. Wan, Y. Ding, S. Wu, Y. Zhang, X. Zhang, G. Zhang, Y. Xiong, X. Wu and J. Yang, Adv. Mater., 2017, 29, 1702428 CrossRef PubMed.
- S. Matsuoka, T. Kohzuki, Y. Kuwana, A. Nakamura and S. Yanagida, J. Chem. Soc., Perkin Trans. 2, 1992, 679–685 RSC.
- P. Guiglion, C. Butchosa and M. A. Zwijnenburg, J. Mater. Chem. A, 2014, 2, 11996–12004 RSC.
- X. Wang, L. Chen, S. Y. Chong, M. A. Little, Y. Wu, W.-H. Zhu, R. Clowes, Y. Yan, M. A. Zwijnenburg and R. S. Sprick, Nat. Chem., 2018, 10, 1180–1189 CrossRef CAS PubMed.
- S. Bi, Z. A. Lan, S. Paasch, W. Zhang, Y. He, C. Zhang, F. Liu, D. Wu, X. Zhuang and E. Brunner, Adv. Funct. Mater., 2017, 27, 1703146 CrossRef.
- C. B. Meier, R. S. Sprick, A. Monti, P. Guiglion, J.-S. M. Lee, M. A. Zwijnenburg and A. I. Cooper, Polymer, 2017, 126, 283–290 CrossRef CAS.
- R. S. Sprick, A. Thomas and U. Scherf, Polym. Chem., 2010, 1, 283–285 RSC.
- J.-X. Jiang, F. Su, A. Trewin, C. D. Wood, N. L. Campbell, H. Niu, C. Dickinson, A. Y. Ganin, M. J. Rosseinsky and Y. Z. Khimyak, Angew. Chem., 2007, 119, 8728 CrossRef.
- R. S. Sprick, J.-X. Jiang, B. Bonillo, S. Ren, T. Ratvijitvech, P. Guiglion, M. A. Zwijnenburg, D. J. Adams and A. I. Cooper, J. Am. Chem. Soc., 2015, 137, 3265–3270 CrossRef CAS.
- Y. Xu, N. Mao, C. Zhang, X. Wang, J. Zeng, Y. Chen, F. Wang and J.-X. Jiang, Appl. Catal., B, 2018, 228, 1–9 CrossRef.
- Y. Liu, Z. Liao, X. Ma and Z. Xiang, ACS Appl. Mater. Interfaces, 2018, 10, 30698–30705 CrossRef CAS PubMed.
- X. Zhou, X. Yu, L. Peng, J. Luo, X. Ning, X. Fan, X. Zhou and X. Zhou, J. Colloid Interface Sci., 2024, 671, 134–144 CrossRef CAS PubMed.
- Y. Xian, Z. Li, L. Peng, J. Luo, X. Ning, X. Zhou and X. Zhou, Sep. Purif. Technol., 2024, 345, 127337 CrossRef CAS.
- R. S. Sprick, Z. Chen, A. J. Cowan, Y. Bai, C. M. Aitchison, Y. Fang, M. A. Zwijnenburg, A. I. Cooper and X. Wang, Angew. Chem., Int. Ed., 2020, 59, 18695–18700 CrossRef CAS PubMed.
- G. Zhang, C. Huang and X. Wang, Small, 2015, 11, 1215–1221 CrossRef CAS PubMed.
- D. Kong, Y. Zheng, M. Kobielusz, Y. Wang, Z. Bai, W. Macyk, X. Wang and J. Tang, Mater. Today, 2018, 21, 897–924 CrossRef CAS.
- H. Zhang, W. Tian, X. Guo, L. Zhou, H. Sun, M. O. Tadé and S. Wang, ACS Appl. Mater. Interfaces, 2016, 8, 35203–35212 CrossRef CAS.
- L. Wang, Y. Wan, Y. Ding, Y. Niu, Y. Xiong, X. Wu and H. Xu, Nanoscale, 2017, 9, 4090–4096 RSC.
- A. Ejsmont, A. Jankowska and J. Goscianska, Catalysts, 2022, 12, 110 CrossRef CAS.
- M. Prasad, V. Sharma, A. Rokade, P. Ilaiyaraja, S. Chandran and S. Jadkar, Ionics, 2017, 23, 3401–3408 CrossRef CAS.
- B. Sarkodie, J. Amesimeku, C. Frimpong, E. K. Howard, Q. Feng and Z. Xu, Chemosphere, 2023, 313, 137654 CrossRef CAS PubMed.
- N. A. Barakat, N. A. Erfan, A. A. Mohammed and S. E. Mohamed, Colloids Surf., A, 2020, 604, 125307 CrossRef CAS.
- Y. Li, J. Zhu, H. Cheng, G. Li, H. Cho, M. Jiang, Q. Gao and X. Zhang, Adv. Mater. Technol., 2021, 6, 2100410 CrossRef.
- R. Afeesh, N. A. Barakat, S. S. Al-Deyab, A. Yousef and H. Y. Kim, Colloids Surf., A, 2012, 409, 21–29 CrossRef CAS.
- X. Cao, W. Chen, P. Zhao, Y. Yang and D.-G. Yu, Polymers, 2022, 14, 3990 CrossRef CAS.
- N. A. Barakat, G. M. Tolba and K. A. Khalil, Polymers, 2022, 14, 523 CrossRef CAS PubMed.
- A. Augustin, P. Ganguly, S. Shenoy, C. Chuaicham, S. C. Pillai, K. Sasaki, A. F. Lee and K. Sekar, Adv. Sustainable Syst., 2024, 2400321 CrossRef.
- A. Popova, Coke Chem., 2017, 60, 361–365 CrossRef.
- N. A. Barakat, M. S. Khil, F. A. Sheikh and H. Y. Kim, J. Phys. Chem. C, 2008, 112, 12225–12233 CrossRef CAS.
- M. A. Kanjwal, F. A. Sheikh, N. A. Barakat, X. Li, H. Y. Kim and I. S. Chronakis, J. Nanoeng. Nanomanuf., 2011, 1, 196–202 CrossRef CAS.
- I. M. Jipa, A. Stoica, M. Stroescu, L.-M. Dobre, T. Dobre, S. Jinga and C. Tardei, Chem. Pap., 2012, 66, 138–143 CAS.
- A. S. Asran, S. Henning and G. H. Michler, Polymer, 2010, 51, 868–876 CrossRef CAS.
- M. Hafeez, R. Shaheen, B. Akram, S. Haq, S. Mahsud, S. Ali and R. T. Khan, Mater. Res. Express, 2020, 7, 025019 CrossRef CAS.
- Z. Nickolov, G. Georgiev, D. Stoilova and I. Ivanov, J. Mol. Struct., 1995, 354, 119–125 CrossRef CAS.
- C.-W. Tang, C.-B. Wang and S.-H. Chien, Thermochim. Acta, 2008, 473, 68–73 CrossRef CAS.
- G. Beamson and D. Briggs, Mol. Phys., 1992, 76, 919–936 CrossRef CAS.
- J.-B. Lhoest, P. Bertrand, L. Weng and J.-L. Dewez, Macromolecules, 1995, 28, 4631–4637 CrossRef CAS.
- B. J. Tufts, I. L. Abrahams, C. E. Caley, S. R. Lunt, G. M. Miskelly, M. J. Sailor, P. G. Santangelo, N. S. Lewis, A. L. Roe and K. O. Hodgson, J. Am. Chem. Soc., 1990, 112, 5123–5136 CrossRef CAS.
- S. Srivastava, S. Badrinarayanan and A. Mukhedkar, Polyhedron, 1985, 4, 409–414 CrossRef CAS.
- M. Ackeret and B. D. Ratner, Surf. Sci. Spectra, 1992, 1, 108–111 CrossRef CAS.
- H. Hantsche, Adv. Mater., 1993, 5, 778 CrossRef.
- D. L. Blanchard and D. Baer, Surf. Sci., 1992, 276, 27–39 CrossRef CAS.
- J. A. Gardella, S. A. Ferguson and R. L. Chin, Appl. Spectrosc., 1986, 40, 224–232 CrossRef CAS.
- B. J. Tan, K. J. Klabunde and P. M. Sherwood, J. Am. Chem. Soc., 1991, 113, 855–861 CrossRef CAS.
- T. Chuang, C. Brundle and D. Rice, Surf. Sci., 1976, 59, 413–429 CrossRef CAS.
- G. Allen, S. Harris, J. Jutson and J. Dyke, Appl. Surf. Sci., 1989, 37, 111–134 CrossRef CAS.
- C. Strydom and H. Strydom, Inorg. Chim. Acta, 1989, 159, 191–195 CrossRef CAS.
- J. Bonnelle, J. Grimblot and A. D'huysser, J. Electron Spectrosc. Relat. Phenom., 1975, 7, 151–162 CrossRef CAS.
- S. S. Abdullahi, S. Güner, Y. Koseoglu, I. M. Musa, B. I. Adamu and M. I. Abdulhamid, Journal of the Nigerian Association of Mathematical Physics, 2016, 35, 241–246 Search PubMed.
- W. E. Vargas and G. A. Niklasson, Appl. Opt., 1997, 36, 5580–5586 CrossRef CAS PubMed.
- S. Landi Jr, I. R. Segundo, E. Freitas, M. Vasilevskiy, J. Carneiro and C. J. Tavares, Solid State Commun., 2022, 341, 114573 CrossRef.
- Ł. Haryński, A. Olejnik, K. Grochowska and K. Siuzdak, Opt. Mater., 2022, 127, 112205 CrossRef.
- S. Li, Y. Liu, K. Feng, C. Li, J. Xu, C. Lu, H. Lin, Y. Feng, D. Ma and J. Zhong, Angew. Chem., 2023, 135, e202308670 CrossRef.
- B. Tahir, M. Tahir, N. Kumar, M. Siraj and A. Fatehmulla, Mater. Sci. Semicond. Process., 2024, 178, 108379 CrossRef CAS.
- Z. Haider and Y. S. Kang, ACS Appl. Mater. Interfaces, 2014, 6, 10342–10352 CrossRef CAS PubMed.
- C. Li, S. Yu, H. Dong, C. Liu, H. Wu, H. Che and G. Chen, Appl. Catal., B, 2018, 238, 284–293 CrossRef CAS.
- X. Li, J. Xiong, Y. Xu, Z. Feng and J. Huang, Chin. J. Catal., 2019, 40, 424–433 CrossRef CAS.
- P. K. Panda, B. Sahoo and S. Ramakrishna, Energy Technol., 2023, 11, 2201434 CrossRef.
- N. Lu, M. Zhang, X. Jing, P. Zhang, Y. Zhu and Z. Zhang, Energy Environ. Mater., 2023, 6, e12338 CrossRef CAS.
| This journal is © The Royal Society of Chemistry 2024 |

