 Open Access Article
Creative Commons Attribution 3.0 Unported Licence
Stabilisation of solid-state cubic ammonia confined in a glass substance at ambient temperature under atmospheric pressure†
Masao Morishita *a,
Hayate Miyoshib,
Haruto Kawasakib and
Hidefumi Yanagitac
aNational Institute for Materials Science (NIMS) (Formerly Department of Chemical Engineering and Materials Science), University of Hyogo, Japan. E-mail: MORISHITA.Masao@nims.go.jp
bDepartment of Chemical Engineering and Materials Science, University of Hyogo, Japan
cSanalloy Industry Co., Ltd, Japan
First published on 20th May 2024
Abstract
Ammonia, a widely available compound, exhibits structural transitions from solid to liquid to gas depending on temperature, pressure, and chemical interactions with adjacent atoms, offering valuable insights into planetary science. It serves as a significant hydrogen storage medium in environmental science, mitigating carbon dioxide emissions from fossil fuels. However, its gaseous form, NH3(g), poses health risks, potentially leading to fatalities. The sublimation pressure (psub) of solid cubic ammonia, NH3(cr), below 195.5 K is minimal. In this study, we endeavoured to stabilise NH3(cr) at room temperature for the first time. Through confinement within a boric acid glass matrix, we successfully synthesised and stabilised cubic crystal NH3(cr) with a lattice constant of 0.5165 nm under atmospheric pressure. Thermodynamic simulations affirmed the stabilisation of NH3(cr), indicating its quasi-equilibrium state based on the estimated standard Gibbs energy of formation,  . Despite these advancements, the extraction of H2(g) from NH3(cr) within the boric acid glass matrix remains unresolved. The quest for an external matrix with catalytic capabilities to decompose inner NH3(cr) into H2(g) and N2(g) presents a promising avenue for future research. Achieving stability of the low-temperature phase at ambient conditions could significantly propel exploration in this field.
Introduction
Ammonia, abundant throughout the cosmos, plays a crucial role in various celestial bodies. Within the depths of Uranus and Neptune, the presence of “hot ice” is notable, comprised of water, methane, and ammonia, sustained under high temperature and pressure. This compound also manifests as stoichiometric ammonia hydrates in many of the icy moons orbiting the outer planets.2 Moreover, in the atmospheric layers of Jupiter, ammonia functions as a significant chemical constituent.3 This cosmic ubiquity of ammonia underscores its relevance to the origins of life, as it constitutes an essential element of the planetary environments. Notably, in practical applications on Earth, ammonia serves as a foundational material for the production of urea fertilisers via the Haber–Bosch process, a critical measure in averting food crises.4 Furthermore, from an environmental science perspective, ammonia holds promise as a hydrogen storage medium for mitigating carbon dioxide emissions stemming from fossil fuel utilisation.5–10 The foundational understanding of ammonia spans disciplines such as space exploration, life sciences, material engineering, and environmental studies, primarily revolving around its stability across different phases: solid, liquid, and gas.11–19 Pressure–temperature diagrams detailing these phases have been meticulously constructed, underscoring the versatile nature of ammonia. For instance, its triple point, occurring at 195.5 K and 0.0609 bar, highlights the stability of its gas phase even at ambient temperatures under atmospheric pressure. Notably, our recent advancements have led to the synthesis of solid-state ammonia, adopting a cubic structure within boric acid through an innovative freeze-drying technique. This breakthrough opens avenues for further exploration at the forefronts of diverse scientific domains, hinting at promising implications and applications of cubic ammonia.1–19Shifting perspectives towards utilising ammonia as a hydrogen storage material prompts consideration of the challenges associated with its storage and transport due to its harmful effects on human health. These effects encompass potential eye damage upon contact, respiratory distress upon inhalation, and the risk of impaired consciousness due to elevated blood ammonia levels, which can prove fatal in severe cases. Thus, this study delves into investigating small-scale and distributed mild-type ammonia production as a viable alternative.
To enhance the Harber–Boesch process,4 we explore the low-pressure synthesis of ammonia utilising lithium compound catalysts.5 Furthermore, alternative methods for ammonia production are investigated, including the cleavage of strong N–N bonds in N2(g) molecules through electrolysis,6–8 discharge processes,9 and surface plasmon resonance.10
Conversely, ammonia can be transformed into H2(g) and N2(g) with the aid of appropriate catalysts such as Ni,20 zeolites,21 and CaNH.22 The resulting H2(g) can then be separated using a membrane for efficient utilisation.23 Additionally, the solid-state cubic NH3(cr) with its low sublimation pressure presents another potential avenue for hydrogen storage and supply, particularly in small-scale and distributed mild-type production scenarios. Notably, this study marks the first description of the synthesis and thermodynamic analysis of cubic ammonia.
Experimental
Process design
The triple point of NH3 is characterised by specific temperature (195.5 K) and pressure (0.0609 bar) values.11–19 Below 195.5 K and at pressures exceeding 0.0609 bar, NH3 exists in its solid-state cubic form.24,25 Given this, achieving the stabilisation of solid-state cubic-NH3(cr) at ambient temperature and atmospheric pressure presents significant challenges. To address this obstacle, we developed a process design aimed at creating an embedded structure. This structure effectively confined NH3(cr) within a glass matrix, thereby enabling the stabilisation of NH3(cr) at ambient temperatures and under atmospheric pressure.Fig. 1(a) depicts a unit cell of cubic-NH3(cr),24–26 comprising four molecules denoted by open circles. Fig. 1(b) presents a schematic illustrating the process design. In this design, a boric glass shell serves as the matrix for confining the NH3(cr). The glass matrix, termed B2O3(gl)–B(OH)3(gl), is composed of boron trioxide (B2O3(gl)) and orthoboric acid (B(OH)3(gl)), synthesised by the dehydration of an aqueous solution resulting from the mixing of B2O3(cr) and pure water. Importantly, the geometric structure of NH3(cr) is confined within the B2O3(gl)–B(OH)3(gl) matrix.
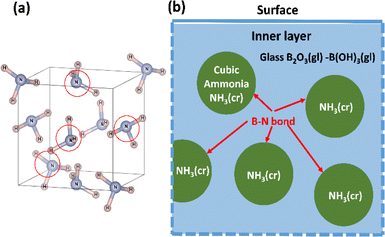 | ||
| Fig. 1 (a) Unit cell of cubic NH3(cr)24–26 composed of four molecules marked with open circle; (b) schematic model for stabilising the solid-state cubic ammonia (NH3(cr)) at ambient temperature, which is otherwise only stable below 195.5 K under atmospheric pressure. | ||
It is noteworthy that in the cubic boron nitride (cBN) crystals, the covalent bond between a boron and a nitrogen atom is exceptionally strong. Similarly, a strong B–N bond27 is formed at the interface between the NH3(cr) and the B2O3(gl)–B(OH)3(gl) glass matrix. This robust interface is anticipated to stabilise the cubic structure of NH3(cr), ensuring stability under ambient temperature and atmospheric pressure conditions.
The freeze-drying technique was utilised to encapsulate cubic NH3(cr) within B2O3(gl)–B(OH)3(gl). Initially, a frozen mixture of ammonia and boric acid in water was prepared at 77 K through liquid-nitrogen cooling, wherein ammonia was trapped as frozen ammonium (NH4+ (cr)) ions within ice (H2O(cr)). Subsequently, NH4+(cr) needed to undergo a reaction with hydroxide ions (OH−(cr)) within the ice to achieve charge neutrality and enable sublimation into NH3(g). However, OH−(cr) mobility is restricted at low temperatures, resulting in condensation of NH4+(cr). Finally, the removal of the ice molecules (H2O(cr)) facilitated the containment of NH3(cr) within B2O3(gl)–B(OH)3(gl).
Sample preparation
Commercial aqueous ammonia solution (29 mass% NH3(aq.), Kanto Chemical Co., Ltd, Tokyo) and boron trioxide powder (B2O3(cr), 99.9%, Kojundo Chemical Laboratory Co., Ltd, Saitama) served as the starting materials. To ensure the stability of the NH3(cr) within the embedded structure, crucial for the formation of B–N bonds27 (Fig. 2), a 1![[thin space (1/6-em)]](https://www.rsc.org/images/entities/char_2009.gif) :
:![[thin space (1/6-em)]](https://www.rsc.org/images/entities/char_2009.gif) 1 relative ratio of B to N was targeted. Thus, 160 mg of B2O3(cr) powder and 0.3 mL of 29 mass% NH3(aq.) were employed, equating to 4.6 × 10⁻³ moles for both B and N. Initially, the required amount of B2O3(cr) powder was placed in a test tube, followed by addition of NH3(aq.) to impregnate the B2O3(cr) powder. Subsequently, the test tube containing NH3(aq.)-impregnated-B2O3(cr) powder was sealed with a rubber cap, featuring a centrally punched hole (diameter 0.5 mm) for vacuum evacuation during the freeze-drying process.
1 relative ratio of B to N was targeted. Thus, 160 mg of B2O3(cr) powder and 0.3 mL of 29 mass% NH3(aq.) were employed, equating to 4.6 × 10⁻³ moles for both B and N. Initially, the required amount of B2O3(cr) powder was placed in a test tube, followed by addition of NH3(aq.) to impregnate the B2O3(cr) powder. Subsequently, the test tube containing NH3(aq.)-impregnated-B2O3(cr) powder was sealed with a rubber cap, featuring a centrally punched hole (diameter 0.5 mm) for vacuum evacuation during the freeze-drying process.
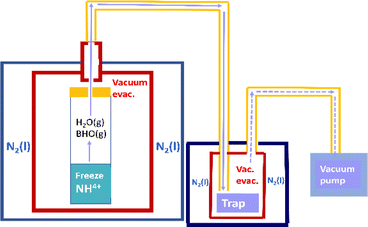 | ||
| Fig. 2 Schematic of freeze-drying apparatus and method for synthesising the solid-state cubic-NH3(cr). | ||
Fig. 2 depicts a schematic of the apparatus utilised for freeze-drying. A test tube containing NH3(aq.)-impregnated B2O3(cr) powder, sealed with a rubber cap, was positioned within a custom-made copper reaction vessel. An exhaust port was integrated into the copper vessel to facilitate vacuum evacuation. Once the copper vessel, along with the test tube, was placed in a thermostatic bath, liquid nitrogen was employed to freeze the moisture, ammonium ions (NH4+(aq.)), and hydroxide ions (OH−(aq.)). Subsequently, after 1 h, frozen H2O(cr) was sublimated via vacuum evacuation for 2 h at 77 K, with NH4+(aq.) being condensed using a rotary vacuum pump. Following freeze-drying, the copper vessel was promptly removed to prevent moisture adsorption by the freeze-dried products (FD products) due to condensation. Evacuation using a vacuum pump persisted for 1 h at 295 K. Finally, the FD products were collected.
Throughout the freeze-drying process, NH3(g)28 and BHO(g)29 were generated. These gaseous molecules were captured in an aqueous boric acid solution using a trap, as illustrated in Fig. 3. The trapped species could subsequently be utilised in the recycling process to produce FD products.
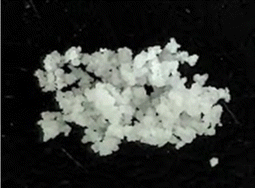 | ||
| Fig. 3 FD product obtained through freeze-drying, comprising solid-state cubic NH3(cr) as the main constituent. | ||
The phases present in the collected FD products were identified through a combination of techniques. X-ray diffraction (XRD) analysis was conducted using a Rigaku, Ultima IV instrument (Tokyo) while laser Raman spectroscopy was performed with a Nano Photon RAMAN Touch system (Osaka).
To determine the boron content within the FD products, inductively coupled plasma emission spectroscopy (ICP, Shimadzu, ICPS-8100, Kyoto) was employed.
The hydrogen and nitrogen contents were assessed utilising combustion thermal conductivity analysis (Elementar, VarioV MACRO, Yokohama).
For evaluating the upper storage temperature of NH3(cr), thermogravimetric analysis (TG, Rigaku, Thermoplus, TG 8110, Tokyo) was employed.
To analyse the contents of H2 and NH3 gases that evolved from the sample during thermal decomposition, gas and ion analyses were performed. Gas analysis was conducted using a J-Science lab GC7100 instrument (Kyoto), while ion analysis utilised a Thermo Fisher Scientific Integrion RFIC (Tokyo) system.
The penetration depth of X-rays, approximately 30 μm, allows for effective analysis of the structure of NH3(cr) embedded within the inner layer using XRD.30 However, the limitations of laser Raman spectroscopy lie in its restricted penetration depths, largely confined to the shallow layers near the surface due to the wavelength constraints of the laser. Consequently, the intensity of the spectrum originating from the inner layer tends to be weak. To supplement Raman spectroscopy, thermodynamic simulations were conducted to validate the formation of cubic ammonia.31–36
Results and discussions
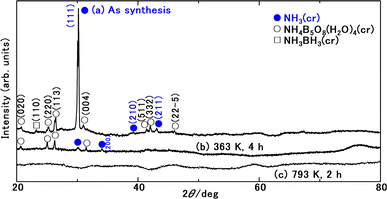
Fig. 3 presents the FD product, appearing as a white powder at 297 K under atmospheric pressure. Analysis of XRD patterns (Fig. 4) confirmed that the FD product consisted predominantly of solid-state cubic NH3(cr). In contrast to the commercial aqueous ammonia solution, which emits a pungent odour due to NH3(g) vaporisation, the odourless nature of the FD product, composed of NH3(cr), was noteworthy.Fig. 4(a) depicts the XRD pattern of the FD product recorded at 297 K, revealing its main constituent as NH3(cr). The prominent peak observed at a 2θ value of 30.18° in this FD product aligned consistently with that of the solid-state cubic NH3(cr) detected at 171,24,25 160,26 and 77 K (ref. 24 and 25) via in situ XRD conducted by Olovson and Templeton,24,25 as well as by Boese et al.26 Notably, the NH3(cr), which is naturally stable below 195.5 K under atmospheric pressure, was maintained at 297 K.
The lattice constant of the NH3(cr) in the FD product was determined through extrapolation of the diffraction data at a 2θ of 90.00°.30 Subsequently, utilising eqn (1), the lattice constants were computed for the (111), (210), and (211) planes at various diffraction angles denoted as 2θ°.
 | (1) |
In eqn (1) the Cu Kα-ray wavelength is 0.154056 nm, and h, k, and l represent the plane indices. As shown in Fig. 5, the lattice constants derived from the (111), (210), and (211) planes were plotted against 1/2(cos2![[thin space (1/6-em)]](https://www.rsc.org/images/entities/char_2009.gif) θ/sin
θ/sin![[thin space (1/6-em)]](https://www.rsc.org/images/entities/char_2009.gif) θ + cos2
θ + cos2![[thin space (1/6-em)]](https://www.rsc.org/images/entities/char_2009.gif) θ/θ), employing the least squares method, the lattice constant was extrapolated at a 2θ of 90.00° to ascertain its precise value.
θ/θ), employing the least squares method, the lattice constant was extrapolated at a 2θ of 90.00° to ascertain its precise value.
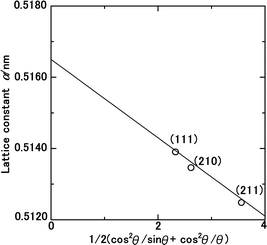 | ||
| Fig. 5 Lattice constant as function of the diffraction degree, θ, for the solid-state cubic ammonia (NH3(cr)) at 297 K. | ||
Table 1 presents a comparative analysis of cubic lattice constants, denoted as ‘a’, for NH3(cr) as determined in this study alongside values obtained at various temperatures, namely 171,24,25 160,26 and 77 K,24,25 through in situ XRD conducted by Olovson and Templeton,24,25 as well as by Boese et al.26 The lattice constant of 0.5165 nm identified in our investigation aligned closely with 0.5138,24,25 0.51305,26 and 0.508424,25 nm recorded at 171,24,25 160,26 and 77![[thin space (1/6-em)]](https://www.rsc.org/images/entities/char_2009.gif) 24,25 K, respectively.
24,25 K, respectively.
![[thin space (1/6-em)]](https://www.rsc.org/images/entities/char_2009.gif) 24,25 K, as reported by Olovson and Templeton24,25 and Boese et al.,26 and α estimated from these data
24,25 K, as reported by Olovson and Templeton24,25 and Boese et al.,26 and α estimated from these data
To assess thermal expansion, the coefficient α was computed by differentiating the data between 297 K in our study and 171 K as per Olovson and Templeton.24,25 This was then compared with the findings reported by Olovson and Templeton24,25 and Boese et al.26 for the temperature range spanning from 160 (ref. 26) to 77 K,24,25 as detailed in Table 1. The resulting coefficients were determined to be 1.26 × 10⁻⁴ and 3.34 × 10⁻⁴, respectively.
These values are intricately linked to variations in the lattice vibration modes relative to temperature. Notably, larger coefficients are discernible within the lower temperature spectrum compared to those approximated around ambient conditions, aligning with both theoretical predictions31 and empirical evidence.31–36 The diffraction peaks from other planes of NH3(cr) were difficult to detect, being likely that X-ray intensity was decreased during penetrating GM. However, the determined lattice constant and thermal expansion constant is concluded to be reasonable.
Ammonium pentaborate tetrahydrate (NH4B5O8·4H2O(cr))37 and ammonia borane (NH3BH3(cr))38–43 are shown in Fig. 4(a). These include impurity phases stemming from the sub raw material B2O3(cr).
Shore and Böddeker39 demonstrated the preparation process of NH3BH3(cr), which involves several steps: (A) dispersing diborane (B2H6(g)) in tetrahydrofuran (THF) at 195 K to yield THF·BH3; (B) distilling liquid NH3(l) onto the THF solution followed by stirring; (C) distilling away NH3(g) and THF, subsequently extracting NH3BH3(cr) either from the remaining solid mixture of NH3BH3(cr) or diammoniate of diborane H3B(NH3)2+BH4−. Remarkably, the current process for producing the FD product closely mirrored the aforementioned synthesis of NH3BH3 at low temperatures by Shore and Böddeker.39
Fig. 6 displays the Raman spectrum of NH3(cr) within the FD product, compared with one measured by the spectrum obtained via in situ Raman spectroscopy conducted by Nye and Medina at 93.6 K.12 The peaks A, B, and C observed in NH3(cr) within the FD product aligned consistently with the peaks a, b, and c detected in the low-temperature in situ measurements by Nye and Medina at 93.6 K.12 These peaks correspond to the Raman scattering spectra originating from the intermolecular vibrations of the ammonia molecules within the cubic unit cell, as illustrated in Fig. 1(a). Notably, the peak intensity of NH3(cr) was relatively low owing to confinement within the glass matrix, which limited the penetration of laser-induced Raman scattering.
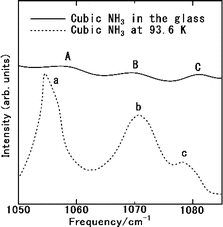 | ||
| Fig. 6 Raman spectrum of the cubic ammonia (NH3(cr)) confined in the glass matrix, compared with one measured by the in situ Raman spectroscopy by Nye and Medina at 93.6 K.12 | ||
Fig. 4(b) depicts the XRD pattern of the sample after maintaining the FD product following a duration of 4 h at 363 K. Notably, the disappearance of peaks corresponding to NH3(cr) signified sublimation into NH3(g), as described by reaction (I) in Table 2. Consequently, solely the peaks attributable to the remaining NH4B5O8·4H2O(cr) remained observable. This conversion of stored NH3(cr) into NH3(g) was notable for its lower energy consumption.
| NH3(cr) ⇌ NH3(g) | (I) |
| NH4B5O8·4H2O(cr) ⇌ NH3(g) + 4H2O(g) + 2B2O3(gl) + BHO(g) + 1/2O2(g) | (II) |
| B(OH)3(gl) ⇌ (1/2)B2O3(gl) + (3/2)H2O(g) | (III) |
| B2O3(gl) + B(OH)3(gl) ⇌ 3BHO(g) + 3/2O2(g) | (IV) |
Fig. 4(c) illustrates the XRD pattern of the sample after subjecting the FD product at 793 K for 2 h. The absence of peaks associated with NH4B5O8·4H2O(cr) suggested its thermal decomposition according to reaction (II) in Table 2. Subsequently, a broad pattern emerged, revealing the presence of the remaining glass matrix (GM) containing the B2O3(gl) and B(OH)3(gl) components.
The thermal decomposition process of orthoboric acid B(OH)3(cr) unfolds in a series of steps.44 First, at 373 K, orthoboric acid B(OH)3(cr) undergoes decomposition to form metabolic acid HBO2(cr).27 Subsequently, at 413 K, metabolic acid HBO2(cr) further decomposes into tetra boric acid H2B4O7(cr).44 Finally, at 573 K, H2B4O7(cr) undergoes decomposition to yield boron trioxide B2O3(cr). Consequently, orthoboric acid B(OH)3(cr) transitions into B2O3(cr), as illustrated in reaction (III) in Table 2.
In a similar vein, a fraction of B(OH)3(gl) within the GM transforms into B2O3(gl), as depicted in reaction (IV) in Table 2, a transformation supported by the B, H, and N elemental analyses. Furthermore, interactions between B2O3(gl) and B(OH)3(gl) lead to the formation of gaseous BHO(g) and 3/2O2(g), a phenomenon also confirmed by elemental analyses.
Table 3 presents the elemental analysis results for B, determined using ICP, and for H and N, analysed via the combustion thermal conductivity. These assessments were conducted for both the FD product and the GM resulting from the thermal decomposition of the FD product at 793 K for 2 h. The values are expressed as mol%, with the O content derived by subtracting the sum of the B, H, and N contents from 100%. Notably, the FD product comprised 47.8 mol% H. In accordance with the sample preparation outlined earlier, 4.6 × 10⁻³ mol of both B and N were utilised, alongside 160 mg of B2O3(cr) powder placed in a test tube, followed by 29 mass% NH3(aq.). Consequently, 205 mg of the FD product was collected. Based on the chemical composition depicted in Table 2, the quantities of N and B in the 205 mg FD product were determined to be 1.6 × 10⁻³ and 3.0 × 10⁻³, respectively. It is noteworthy to consider that portions of N and B may have been lost as sublimed species, NH(g),27 and BHO(g),29 as illustrated in Fig. 3, which were captured as an aqueous ammonium–boric acid solution using a trap positioned between the FD vessel and vacuum pump.
| N/mol% | H/mol% | B/mol% | O/mol% | Remarks | |
|---|---|---|---|---|---|
| FD | 6.1 | 47.8 | 11.9 | 34.2 | ICP & com. |
| GM | 0.3 | 26.8 | 26.1 | 46.8 | ICP & com. |
| Calc. FD | 6.3 | 46.5 | 13.4 | 33.8 | Estimation |
| Calc. GM | 0 | 25.0 | 25.0 | 50.0 | Estimation |
Table 4 presents the molar percentage data detailing the phase constituents of both the FD and GM products, following a temperature hold at 793 K for 2 h. These estimates were derived from the elemental compositions outlined in Table 3. In the FD product, the molar percentages were determined as follows: 37 mol% NH3(cr), 5 mol% NH4B5O8·4H2O(cr), 10 mol% B2O3(gl), and 48 mol% B(OH)3(gl), labelled as calc. FD. Within this, the molar ratio of B2O3(gl) to B(OH)3(gl) was calculated as 0.17![[thin space (1/6-em)]](https://www.rsc.org/images/entities/char_2009.gif) :
:![[thin space (1/6-em)]](https://www.rsc.org/images/entities/char_2009.gif) 0.83. Utilising mass percentage data, the composition revealed 11 mass% NH3(cr), 12 mass% NH4B5O8·4H2O(cr), 24 mass% B2O3(gl), and 53 mass% B(OH)3(gl), with a at B2O3(gl) to B(OH)3(gl) ratio of 0.31
0.83. Utilising mass percentage data, the composition revealed 11 mass% NH3(cr), 12 mass% NH4B5O8·4H2O(cr), 24 mass% B2O3(gl), and 53 mass% B(OH)3(gl), with a at B2O3(gl) to B(OH)3(gl) ratio of 0.31![[thin space (1/6-em)]](https://www.rsc.org/images/entities/char_2009.gif) :
:![[thin space (1/6-em)]](https://www.rsc.org/images/entities/char_2009.gif) 0.69. Notably, B2O3(gl) acted as a glass-forming component, while B(OH)3(gl) dissolved within B2O3(gl), resulting in the formation of a glass structure.
0.69. Notably, B2O3(gl) acted as a glass-forming component, while B(OH)3(gl) dissolved within B2O3(gl), resulting in the formation of a glass structure.
| Calc. FD/mol% | Calc. GM/mol% | |
|---|---|---|
| NH3(cr) in FD | 37 | — |
| NH4B5O8·4H2O(cr) in FD | 5 | — |
| B2O3(gl) in FD | 10 | — |
| B(OH)3(gl) in FD | 48 | — |
| B2O3(gl) at 793 K for 2 h | — | 50 |
| B(OH)3(gl) at 793 K for 2 h | — | 50 |
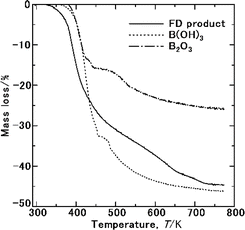
Elemental compositions were deduced from the molar percentage data, consistent with the calculated values for the FD product listed in Table 3. The composition of the calc. FD product aligned with the FD product, affirming the reasonableness of the molar percentage (Table 4). According to XRD (Fig. 4(a–c)) and TG (Fig. 8) analyses, NH3(cr), comprising 37 mol% of the FD product, sublimated into NH3(g) between 325 and 373 K, as expressed in reaction (I) in Table 2. NH4B5O8·4H2O(cr), constituting 5 mol% of the FD product, underwent thermal decomposition to NH3(g) above 373 K, as indicated in reaction (II) in Table 2. The resulting B2O3(gl) and B(OH)3(gl) were absorbed into the GM during the decomposition process. In the FD product, the molar ratio of B2O3(gl) to B(OH)3(gl) was 0.17![[thin space (1/6-em)]](https://www.rsc.org/images/entities/char_2009.gif) :
:![[thin space (1/6-em)]](https://www.rsc.org/images/entities/char_2009.gif) 0.83. Therefore, the shift from a 0.83 ratio of B(OH)3(gl) to B2O3(gl) to a 0.43 ratio resulted in a phase composition similar to that of the GM consisting of 50 mol% B2O3(gl)–50 mol% B(OH)3(gl) after thermal decomposition at 793 K for 4 h. Nitrogen was detected in the elemental composition of GM after decomposition (Table 3). This residual N likely originated from the B–N bonding. However, the details of these coordination states remain unknown.
0.83. Therefore, the shift from a 0.83 ratio of B(OH)3(gl) to B2O3(gl) to a 0.43 ratio resulted in a phase composition similar to that of the GM consisting of 50 mol% B2O3(gl)–50 mol% B(OH)3(gl) after thermal decomposition at 793 K for 4 h. Nitrogen was detected in the elemental composition of GM after decomposition (Table 3). This residual N likely originated from the B–N bonding. However, the details of these coordination states remain unknown.
The quantities of the gaseous components were determined through the sublimation and thermal decomposition reactions outlined in reactions (I–IV) in Table 2. To calculate, we summed the masses of NH3(g) in reaction (I), H2O(g), BHO(g), and O2(g) in reaction (II), as well as H2O(g) in reaction (III), and BHO(g) and O2(g) in reaction (IV). The masses of the gaseous species in reactions (I–III) were assessed based on the molar percentages of the phase constituents. Upon adding the masses of BHO(g) and O2(g) in reaction (V), assuming an equivalent amount of the entire B2O3(gl) formed in the decomposition of the FD product was added to the sum of the masses of the gaseous species in reactions (I–III), we evaluated that 40.8 mass% of the initial FD product underwent gasification. Subsequently, the gasification mass loss during TG, after the completion of thermal decomposition, was determined to be 44.7%. Despite the complexity of the reactions involved, the calculated sum of mass loss during gasification aligned with the mass loss observed in TG. This consistency indicates an efficient conversion of NH3(cr) stored in the FD product (37 mol%) into NH3(g) within the temperature range of 325–373 K, with reduced energy consumption. H2(g) was separated using a hydrogen separation membrane. The solid-state cubic NH3(cr) synthesised in this study holds promise as an excellent hydrogen storage material. Future investigation will focus on determining the relative ratio of NH3(cr) to GM.
The phase stability of the NH3(cr) was investigated by computing its standard Gibbs energy of formation  , with “standard” referring to thermodynamic values under 1 bar. Initially, the Gibbs energy of formation, ΔfGm, for NH3(g) at 195.5 K under 0.0609 bar—representing the temperature and pressure of the triple point—was calculated.11–19 Given that NH3(cr) is equilibrated with NH3(g) at the triple point, the ΔfGm datum of NH3(cr) equals that of NH3(g). Subsequently, the
  datum at 298.15 K under 1 bar for cubic NH3(cr) was estimated.
The  datum for NH3(g) at 195.5 K under 1 bar was determined using eqn (2),
 | (2) |
 was taken from the thermodynamic state base (TDB) edited by Barlin (−16.41 kJ (mol of compound)−1),27 and the
  data for NH3(g),45 N2(g),29 and H2(g)29 were adopted from the TDB reported by Wagman and Cox,45 and Chase et al.29
Similarly, the ΔfG datum of NH3(g) at 195.5 K under 0.0609 bar was calculated using eqn (3):
 | (3) |
At the triple point, NH3(cr) is in equilibrium with NH3(g), establishing the equality of their ΔfGm datum, as defined in eqn (4):
| ΔfG(NH3(cr), 195.5 K, 0.0609 bar) = ΔfG(NH3(g), 195.5 K, 0.0609 bar) kJ (mol of compound)−1 | (4) |
The  datum for NH3(cr) at 195.5 K under 1 bar was determined using eqn (5),
 | (5) |
Finally, the  datum of the cubic NH3(cr) at 298.15 K under 1 bar was calculated from eqn (6),
 | (6) |
 data due to lack of direct measurement. The resulting value of
  datum, determined as −12.03 kJ (mol of compound)−1, presents a novel finding, potentially impacting general science, owing to the quasi-equilibrium phase of cubic solid-state ammonia. The thermodynamic data were summarized in Table 5.
Furthermore, the standard Gibbs energy of transition from the gas to cubic state  , at 298.15 K under 1 bar was calculated using eqn (7),
 | (7) |
Hence, to stabilise NH3(cr) at 298.15 K, supplying the  datum is essential. A potential candidate is the phase boundary energy between NH3(cr) and GM, suggesting a strong N–B bond formation, which may stabilize the NH3(cr) structure at ambient pressure. Table S1 (see ESI)† shows the standard Gibbs energies of formation
  for BN(cr),27 CrN(cr),27 and TiN(cr)27 related to the B–N bond along phase boundary between NH3(cr) and GM. Note that cubic BN(cr) having diamond like hardness is quasi equilibrium phase. Therefore, the
  datum27 of BN(cr) was determined for hexagonal structure as the equilibrium phase. The
  data for CrN(cr)27 and TiN(cr)27 are deeply negative consistent with their high hardness due to strong covalency. As a result, they are used as coating materials to give wear resistance. The
  datum of BN(cr)27 is intermediate value of ones of CrN(cr)27 and TiN(cr),27 meaning that the B–N covalent bond in its crystal is robust. From analogical reasoning, the B–N bonds along the phase boundary between NH3(cr) and GM appear to be robust. Another candidate is that the Gibbs energy of mixing, ΔmixG,47,48 indicating deeper equilibrium among NH3(cr), GM, and NH4B5O8·4H2O(cr) than with NH3(g). Additionally, the pressure from the embedded structure, particularly the compression pressure from the outer GM, appears to maintain the cubic structure of NH3(cr). Nonetheless, further investigation is warranted. The B–N bond states along the phase boundary between NH3(cr) and GM are likely to be further investigated by first principles calculation.49 The ternary quasi phase equilibria among NH3(cr)–GM–B5O8·4H2O(cr) is further investigated by the CALPHAD phase diagram calculation.47,48
The  data were derived by extrapolating from the data of solid-state hydrogen, H(cr),50 and nitrogen, N(cr),50 utilising the Neumann–Kopp law. At exceedingly low temperatures, the isochoric heat capacity,
  can be closely approximated by eqn (8), as nearly all phonons predominantly occupy near-ground states, where ‘n’ represents the number of atoms in the formula unit.
 | (8) |
In eqn (8), R is the gas constant (=8.3145 (J K−1 mol−1)) and ΘD is the Debye temperature. Consequently, at low temperatures, ΘD should be independent of T.
 | (9) |
Because  and
and  exhibit striking similarity at extremely low temperatures,33,34,36 ΘD was derived from
  values under 5 K and T, aligning with the relationship defined by eqn (9). ΘD values for H(cr) and N(cr) were subsequently estimated as 141 K and 101 K, respectively.
To extrapolate  across the 0–300 K range, a composite average of
  data of H(cr) and N(cr) was employed, in accordance with the Neumann-Kopp law as shown in Fig. 7. Subsequent evaluation of the
  data involved utilising recently developed formulas,32–36 detailed in the ESI (Table S2).† An optimised fitting function was then obtained and substituted into eqn (6) to ascertain
  .
.
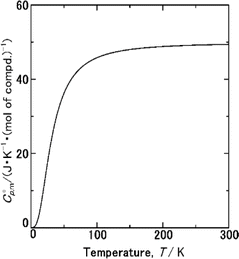 | ||
Fig. 7  data from thermodynamic simulation for solid state cubic NH3(cr) (Table S2†). data from thermodynamic simulation for solid state cubic NH3(cr) (Table S2†). | ||
Fig. 8 shows the TG results of the FD product used to investigate the sublimation of NH3(cr). No mass loss was observed below 325 K, indicating the possibility of the stable storage of the NH3(cr). At 325–750 K, mass loss occurred following reaction (I–IV) in Table 2 due to the sublimation of NH3(cr), the thermal decompositions of NH4B5O8·4H2O and B(OH)3 in GM, and forming BHO gas. The results of the TG data of B(OH)3 and B2O3 as GM forming elements were shown in Fig. 8. In TG of B(OH)3, mass loss occurred due to the thermal decomposition to form B2O3 and forming BHO gas. Since B2O3 is hygroscopic, its part is inevitably changed to form B(OH)3 absorbing atmospheric moisture. Therefore, the mass loss resulted from forming B(OH)3. However, the mole percents of the constituents in FD product was confirmed from B, H and N analyses by ICP spectroscopy and combustion thermal conductivity analysis. Considering hygroscopicity, utilization of B(OH)3 as starting substance is likely to be advantageous. This problem should be further investigated.
Finally, the investigation delved into the potential separation of hydrogen gas (H2(g)) from NH3(cr) confined in GM at 343 K. The process of sublimation posed challenges for the penetration of ammonia gas molecules through the GM layer at this temperature. Consequently, it is conjectured that NH3(cr) likely decomposes into hydrogen and nitrogen atoms, with subsequent penetration of H atoms through the GM layer, resulting in the formation of H2(g) on the surface. Conversely, N atoms are inferred to undergo a reaction with the B atoms in GM, leading to the formation of NH4B5O8·4H2O(cr).
To validate this hypothesis, a sample weighing 0.5 g of FD product was enclosed within a stainless-steel container and subjected to heating in a thermostatic bath at 343 K for 5 min, followed by holding for 6 h. Subsequently, the gas present in the stainless-steel container was collected in a gas bag post-cooling to room temperature. Analysis of the gas composition involved measuring the H2(g) content using a gas chromatograph. The residual gas was absorbed into a boric acid aqueous solution, and the content of NH4+(aq.) was determined using an ion chromatograph to quantify the presence of NH3(g).
Table 6 illustrates the quantities of H2(g) and NH3(g) following the FD product's exposure at 343 K for 6 h. Unfortunately, direct collection of H2(g) from the FD product was not feasible. However, NH3(g) was successfully detected, with a measured quantity of 8.9 mg per gram of FD product. This discovery underscores the efficient collection of NH3(g) at relatively low temperatures, signifying a promising avenue for energy conservation.
| Substance | Amount/mg (g-FD product)−1 |
|---|---|
| H2(g) | None |
| NH3(g) | 8.9 |
Nevertheless, a substantial amount of NH3(cr) is anticipated to remain sequestered within the GM, likely destined for conversion into NH4B5O8·4H2O(cr). This process indicates the potential for exploring alternative matrices with catalytic properties, such as zeolites21 and CaNH22 to facilitate the decomposition of internal NH3(cr) into H2(g) and N2(g). Thus, investigating outer matrices with catalytic capabilities represents an intriguing frontier for future research endeavours.
Conclusion
Renewable energy sources such as solar photovoltaics and wind power are heavily reliant on weather and geography, necessitating complementary energy storage technologies. Ammonia serves as a crucial hydrogen storage substance, yet its gaseous form poses significant health risks, including potential fatality. Thus, safe ammonia storage systems must be developed. Our process design aimed to establish an embedded structure housing solid-state cubic ammonia (NH3(cr)) within a boric acid glass matrix. This innovative approach culminated in the successful synthesis of stable NH3(cr), preserved within the glass matrix under ambient temperature and pressure, facilitated by a freeze-drying process. Thermodynamic simulations validated the stabilisation of NH3(cr), with estimated standard Gibbs energy of formation affirming its stability in a quasi-equilibrium state. The pursuit of an outer matrix with catalytic capabilities, such as zeolites or CaNH, to facilitate the decomposition of inner NH3(cr) into H2(g) and N2(g), emerges as the next frontier in research.Author contributions
M. M. conceived the idea and wrote the paper; H. M. and H. K. synthesized the samples and analysed their constituents and compositions; and H. Y. rendered helpful discussions.Conflicts of interest
There are no conflicts to declare.Acknowledgements
This work was supported in part by the Japan Society for the Promotion of Science (JSPS) under Grant-in-Aid for scientific research 24K08127, an academic research grant from the Hyogo Science and Technology Association, and special research grant for hydrogen energy from the University of Hyogo.References
- W. B. Hubbard, Interior of the Giant Planet, Science, 1981, 214, 145–149 CrossRef CAS PubMed.
- J. S. Kargel, Ammonia-water Volcanism on Icy Satellites: Phase Relations at 1 atmosphere, Icarus, 1992, 100, 556–574 CrossRef CAS.
- P. G. J. Irwin, Cloud Structure and Composition of Jupiter's Atmosphere, Surv. Geophys., 1999, 20, 505–535 CrossRef.
- F. Schüth, R. Palkovitzs, R. Schölgl and D. S. Su, Ammonia as a Possible Element in an Energy Infrastructure: Catalysts for Ammonia Decomposition, Energy Environ. Sci., 2012, 5, 6278–6289, 10.1039/C2EE02865D.
- T. Yamaguchi, K. Shinzato, K. Yamamoto, Y. Wang, Y. Nakagawa, S. Isobe, T. Ichikawa, H. Miyaoka and T. Ichikawa, Pseudo Catalytic Ammonia Synthesis by Lithium–Tin Alloy, Int. J. Hydrogen Energy, 2020, 45, 6806–6812, DOI:10.1016/j.ijhydene.2019.12.190.
- G. Marnellos and M. Stoukides, Ammonia Synthesis at Atmospheric Pressure, Science, 1998, 282, 98–100, DOI:10.1126/science.282.5386.98.
- Y. Sekine and R. Manabe, Reaction Mechanism of Low-Temperature Catalysis by Surface Protonics in an Electric Field, Faraday Discuss., 2021, 229, 341–357, 10.1039/C9FD00129H.
- K. Murakami, Y. Tanaka, R. Sakai, K. Toko, K. Ito, A. Ishikawa, T. Higo, T. Yabe, S. Ogo, M. Ikeda, H. Tsuneki, H. Nakai and Y. Sekine, The Important Role of N2H Formation Energy for Low-Temperature Ammonia Synthesis in an Electric Field, Catal. Today, 2020, 351, 119–124, DOI:10.1016/j.cattod.2018.10.055.
- T. Haruyama, T. Namise, N. Shimomizu, S. Uemura, Y. Takatsuji, M. Hino, R. Yamasaki, T. Kamachi and M. Kohno, Non-catalyzed One-step Synthesis of Ammonia from Atmospheric Air and Water, Green Chem., 2016, 18, 4536–4541, 10.1039/C6GC01560C.
- I. Muzammil, Y.-N. Kim, H. Kang, D. K. Dinh, S. Choi, C. Jung, Y.-H. Song, E. Kim, J. M. Kim and D. H. Lee, Plasma Catalyst-Integrated System for Ammonia Production from H2O and N2 at Atmospheric Pressure, ACS Energy Lett., 2021, 6, 3004–3010, DOI:10.1021/acsenergylett.1c01497.
- R. L. Mills, D. H. Llebenberg and Ph. Pruzan, Phase Diagram and Transition Properties of Condensed Ammonia to 10 kbar, J. Chem. Phys., 1982, 86, 5219–5222 CrossRef CAS.
- C. L. Nye and F. D. Medina, Temperature Dependence of the Raman Spectrum of Ammonia Solid I, J. Chem. Phys., 1987, 87, 6890–6894 CrossRef CAS.
- Y. Enginer, S. Salihoglu and H. Yurtensen, T-P Phase Diagram of Ammonia Solid Phases I, II and III, Mater. Chem. Phys., 2002, 73, 57 CrossRef CAS.
- A. D. Fortes, J. P. Brodholt, I. G. Wood and L. Vočadlo, Hydrogen Bonding in Solid Ammonia from ab Initio Calculations, J. Chem. Phys., 2003, 118, 5987–5994, DOI:10.1063/1.1555630.
- S. Ninet and F. Datchi, High Pressure-High Temperature Phase Diagram of Ammonia, J. Chem. Phys., 2008, 128, 154508 CrossRef CAS PubMed.
- L. Glasser, Equation of State and Phase Diagrams of Ammonia, Res. Sci. Educ., 2009, 86, 1457 CAS.
- S. Ninet and F. Datchi, Problem Disorder and Superionicity in Hot Dence Ammonia Ice, Phys. Rev. Lett., 2012, 108, 165702 CrossRef CAS PubMed.
- X. Yu, X. Jiang, Y. Su and J. Zhao, Compressive Behaviour and Electric Properties of Ammonia Ice: a first-principles study, RSC Adv., 2020, 10, 26579–26587 RSC.
- The Engineering Tool Box, https://www.engineeringtoolbox.com/ammonia-d_1413.html Search PubMed.
- S. F. Yin, B. Q. Xu, X. P. Zhou and C. T. Au, A Mini-Review on Ammonia Decomposition Catalysts for On-Site Generation of Hydrogen for Fuel Cell Application, Appl. Catal., A, 2004, 227, 1–9, DOI:10.1016/j.apcata.2004.09.020.
- X. K. Li, W. J. Ji, J. Zhao, S. J. Wang and C. T. Au, Ammonia Decomposition over Ru and Ni Catalysts Supported on Fumed SiO2, MCM-41, and SBA-15, J. Catal., 2005, 236, 181–189, DOI:10.1016/j.jcat.2005.09.030.
- K. Ogasawara, T. Nakano, K. Kishida, T. N. Ye, Y. Lu, H. Abe, Y. Niwa, M. Sasae, M. Kitano and H. Hosono, Ammonia Decomposition over CaNH-Supported Ni Catalysts via an NH2-Vacancy-Mediated Mars-van Krevelen Mechanism, ACS Catal., 2021, 11, 11005–11015, DOI:10.1021/acscatal.1c01934.
- J. R. Young, Purity of Hydrogen Permeating Through Pd, Pd-25% Ag, and Ni, Rev. Sci. Instrum., 1963, 34, 891–892, DOI:10.1063/1.1718614.
- I. Olovsson and D. H. Templeton, X-ray Study of Solid Ammonia, Acta Crystallogr., 1959, 12, 832–836, DOI:10.1107/S0365110X59002420.
- JCPDS Ref. No. 00-231-0927, http://www.crystallography.net/cod/2310927.html.
- R. Boese, N. Niederprüm, D. Bläser, A. Maulitz, M. Y. Antipin and P. R. Mallinson, Single-Crystal Structure and Electron Density Distribution of Ammonia at 160 K on the Basis of X-ray Diffraction Data, J. Phys. Chem. B, 1997, 101(30), 5794–5799 CrossRef CAS.
- I. Barin, Thermochemical Data of Pure Substance, Part I, VCH Verlagsgessellschaft mbH, Weinheim, 1989, pp. 121, 430, 942, 1543 Search PubMed.
- H. Gamsjäger, J. Bugajski, T. Gajda, R. J. Lemire and W. Preis, Chemical Thermodynamics of Nickel, Nuclear Energy Agency, Organization for Economic Co-operation, Development, Chemical Thermodynamics, ed. North Holland Elsevier Science Publisher B.V., Amsterdam, The Netherlands, 2005, vol. 6, p. 59 Search PubMed.
- M. W. Chace Jr, JANAF Thermochemical Tables, 4th edn, Part 1, American Institute of Physics, 1998, pp. 223, 1310, 1621 Search PubMed.
- B. D. Cullity, ed. G. Matsula, Elements of X-Ray Diffraction, 2nd edn, Agne, Tokyo, 1991, pp. 322–337 Search PubMed.
- G. N. Lewis and M. Randall, ed. K. S. Pitzer and L. Brewer, Thermodynamics :, McGraw-Hill, New York, 1961, pp. 53–58 Search PubMed.
- R. A. Fisher, F. Bouquet, N. E. Phillips, J. P. Franck, G. Zhang, J. E. Gordon and C. Marcenat, Electron, Spin-wave, Hyperfine, and Phonon Contributions to the Low Temperature Specific Heat of La0.65Ca0.35Mn3: Effects of Magnetic Fields and 16O/18O Exchange, Phys. Rev., 2001, 64, 134425 Search PubMed.
- M. Morishita, Y. Kinoshita, H. Houshiyama, A. Nozaki and H. Yamamoto, Thermodynamic Properties for Calcium Molybdate, Molybdenum Tri-oxide and Aqueous Molybdate Ion, J. Chem. Thermodyn., 2017, 114, 30–43 CrossRef CAS.
- M. Morishita, T. Abe, A. Nozaki, I. Ohnuma and K. Kamon, Calorimetric Study of Nd2Fe14B: Heat Capacity, Standard Gibbs Energy of Formation and Magnetic Entropy, Thermochim. Acta, 2020, 690, 178672, DOI:10.1016/j.tca.2020.178672.
- M. Morishita, T. Abe, H. Yamamoto, A. Nozaki and S. Kimura, Thermodynamic and Magnetic Properties for Dy2Fe14B Determined by Heat Capacity Measurement from Very Low to High Temperatures and Solution Calorimetry, Thermochim. Acta, 2023, 721, 179410, DOI:10.1016/j.tca.2022.179410.
- M. Morishita, T. Abe, T. Ohkubo, T. Tadano, H. Yamamoto, A. Nozaki and H. Miyazaki, Magnetic Characterization of Sm(Fe1-x, Cox)11Ti (x = 0, 0.1) Determined by Heat-Capacity Measurement from Very Low to High Temperatures, Thermochim. Acta, 2023, 727, 179573, DOI:10.1016/j.tca.2023.179573.
- JCPDS Ref. No. 00-153-8377.
- JCPDS Ref. No. 00-412-4654.
- S. G. Shore and K. W. Böddeker, Large Scale Synthesis of H3B(NH3)2+BH4− and H3NBH3, Inorg. Chem., 1964, 3, 914–915 CrossRef CAS.
- W. T. Klooster, T. F. Koetzle, P. E. M. Siegbahn, T. B. Richardson and R. H. Crabtree, Study of the N-H⋯H-B Dihydrogen Bond Including the Crystal Structure of BH3NH3 by Neutron Diffraction, J. Am. Chem. Soc., 1999, 27, 6337–6343, DOI:10.1021/ja9825332.
- H. Li, Y. Yan, S. Feng, Y. Chen and H. Fan, Ammonia Borane and IIta Applications in the Advanced energy Technology, J. Energy Resour. Technol., 2021, 143, 110801 CrossRef CAS.
- M. Morishita, A. Nozaki, H. Yamamoto, N. Fukumuro, M. Mori, K. Araki, F. Sakamoto, A. Nakamura and H. Yanagita, Catalytic Activity of Co-Nanocrystal-doped Tungsten Carbide Arising From an Internal Magnetic Field, RSC Adv., 2021, 11, 14063–14070, 10.1039/D1RA01181B.
- M. Morishita, Y. Okumura, R. Fukushima, H. Yamamoto and H. Yanagita, Hydrogen Evolution Reaction Following the Slater – Paulimg Curve: Acceleration of Rate Processes Induced from Dipole Interaction between Protons and Ferromagnetic Catalysts, RSC Adv., 2023, 13, 12941–12950, 10.1039/D2RA07865A.
- S. Mizushima, Encyclopedia Chimica, Kyoritu-pub., Tokyo, 1975, vol. 8, p. 603 Search PubMed.
- J. D. Cox, D. D. Wagman and V. A. Medvedev, CODATA Key Values for Thermodynamics, Hemisphere Publ. Corp., New York, 1989, p. 189 Search PubMed.
- P. W. Atkins and J. de. Paula, Atkins’ Physical Chemistry, ed. M. Nakano, T. Ueda, M. Okumura and Y. Kitagawa, Tokyo-Kagaku-Dojin, Tokyo 1, 10th edn., 2014, p. 80 Search PubMed.
- M. Morishita, K. Koyama, K. Maeda and G. F. Zhang, Calculated Phase Diagram of the Ni–W–B Ternary System, Mater. Trans. JIM, 1999, 40, 600–605 CrossRef CAS.
- M. Morishita, K. Koyama, S. Yagi and G. Zhang, Calculated Phase Diagram of the Ni–Mo–B Ternary System, J. Alloys Compd., 2001, 314, 212–218 CrossRef CAS.
- P. Blaha, K. Schwarz, F. Tran, R. Laskowski, G. K. H. Madsen and L. D. Marks, Wien2k: An APW+lo Program for Calculating the Properties of Solids, J. Chem. Phys., 2020, 152, 074101 CrossRef CAS PubMed.
- R. Hultgren, P. D. Desai, D. T. Hawkins, M. Gleiser, K. K. Kelley and D. D. Wagman, Selected Values of the Thermodynamic Properties of the Elements, Am. Soc. Met., Ohio, 1973, pp. 210–217, 318–324 Search PubMed.
Footnote |
| † Electronic supplementary information (ESI) available. See DOI: https://doi.org/10.1039/d4ra00229f |
| This journal is © The Royal Society of Chemistry 2024 |

